


1. Introduction: The Market Behind the Language Wall
Ask a foreign investor about Japanese real estate, and they will tell you about J-REITs — the listed market with English disclosures, index inclusion, and a Bloomberg ticker for everything. What they will not tell you about is the other market. The one that is roughly twice the size of the listed J-REIT market, growing faster, and conducts virtually all of its business — fundraising, appraisals, transactions, disputes — in Japanese, on paper, and sometimes still by fax.
Japan’s private real estate fund market — unlisted private REITs (shibo REIT) and private funds structured through GK-TK and TMK vehicles — held ¥47.1 trillion (roughly $300 billion) in assets under management as of December 2025, according to a joint survey by the Association for Real Estate Securitization (ARES) and Sumitomo Mitsui Trust Research Institute published in March 2026.¹ That is up 4.9% in six months, in a market where the listed J-REIT sector holds around ¥24 trillion. This is where Japan’s pension money, regional bank deposits, and life insurance premiums actually meet the property market. When an office tower in Otemachi or a logistics shed in Ichikawa trades, this market is usually on one side of the deal — which means it, not the listed market, effectively sets prices.
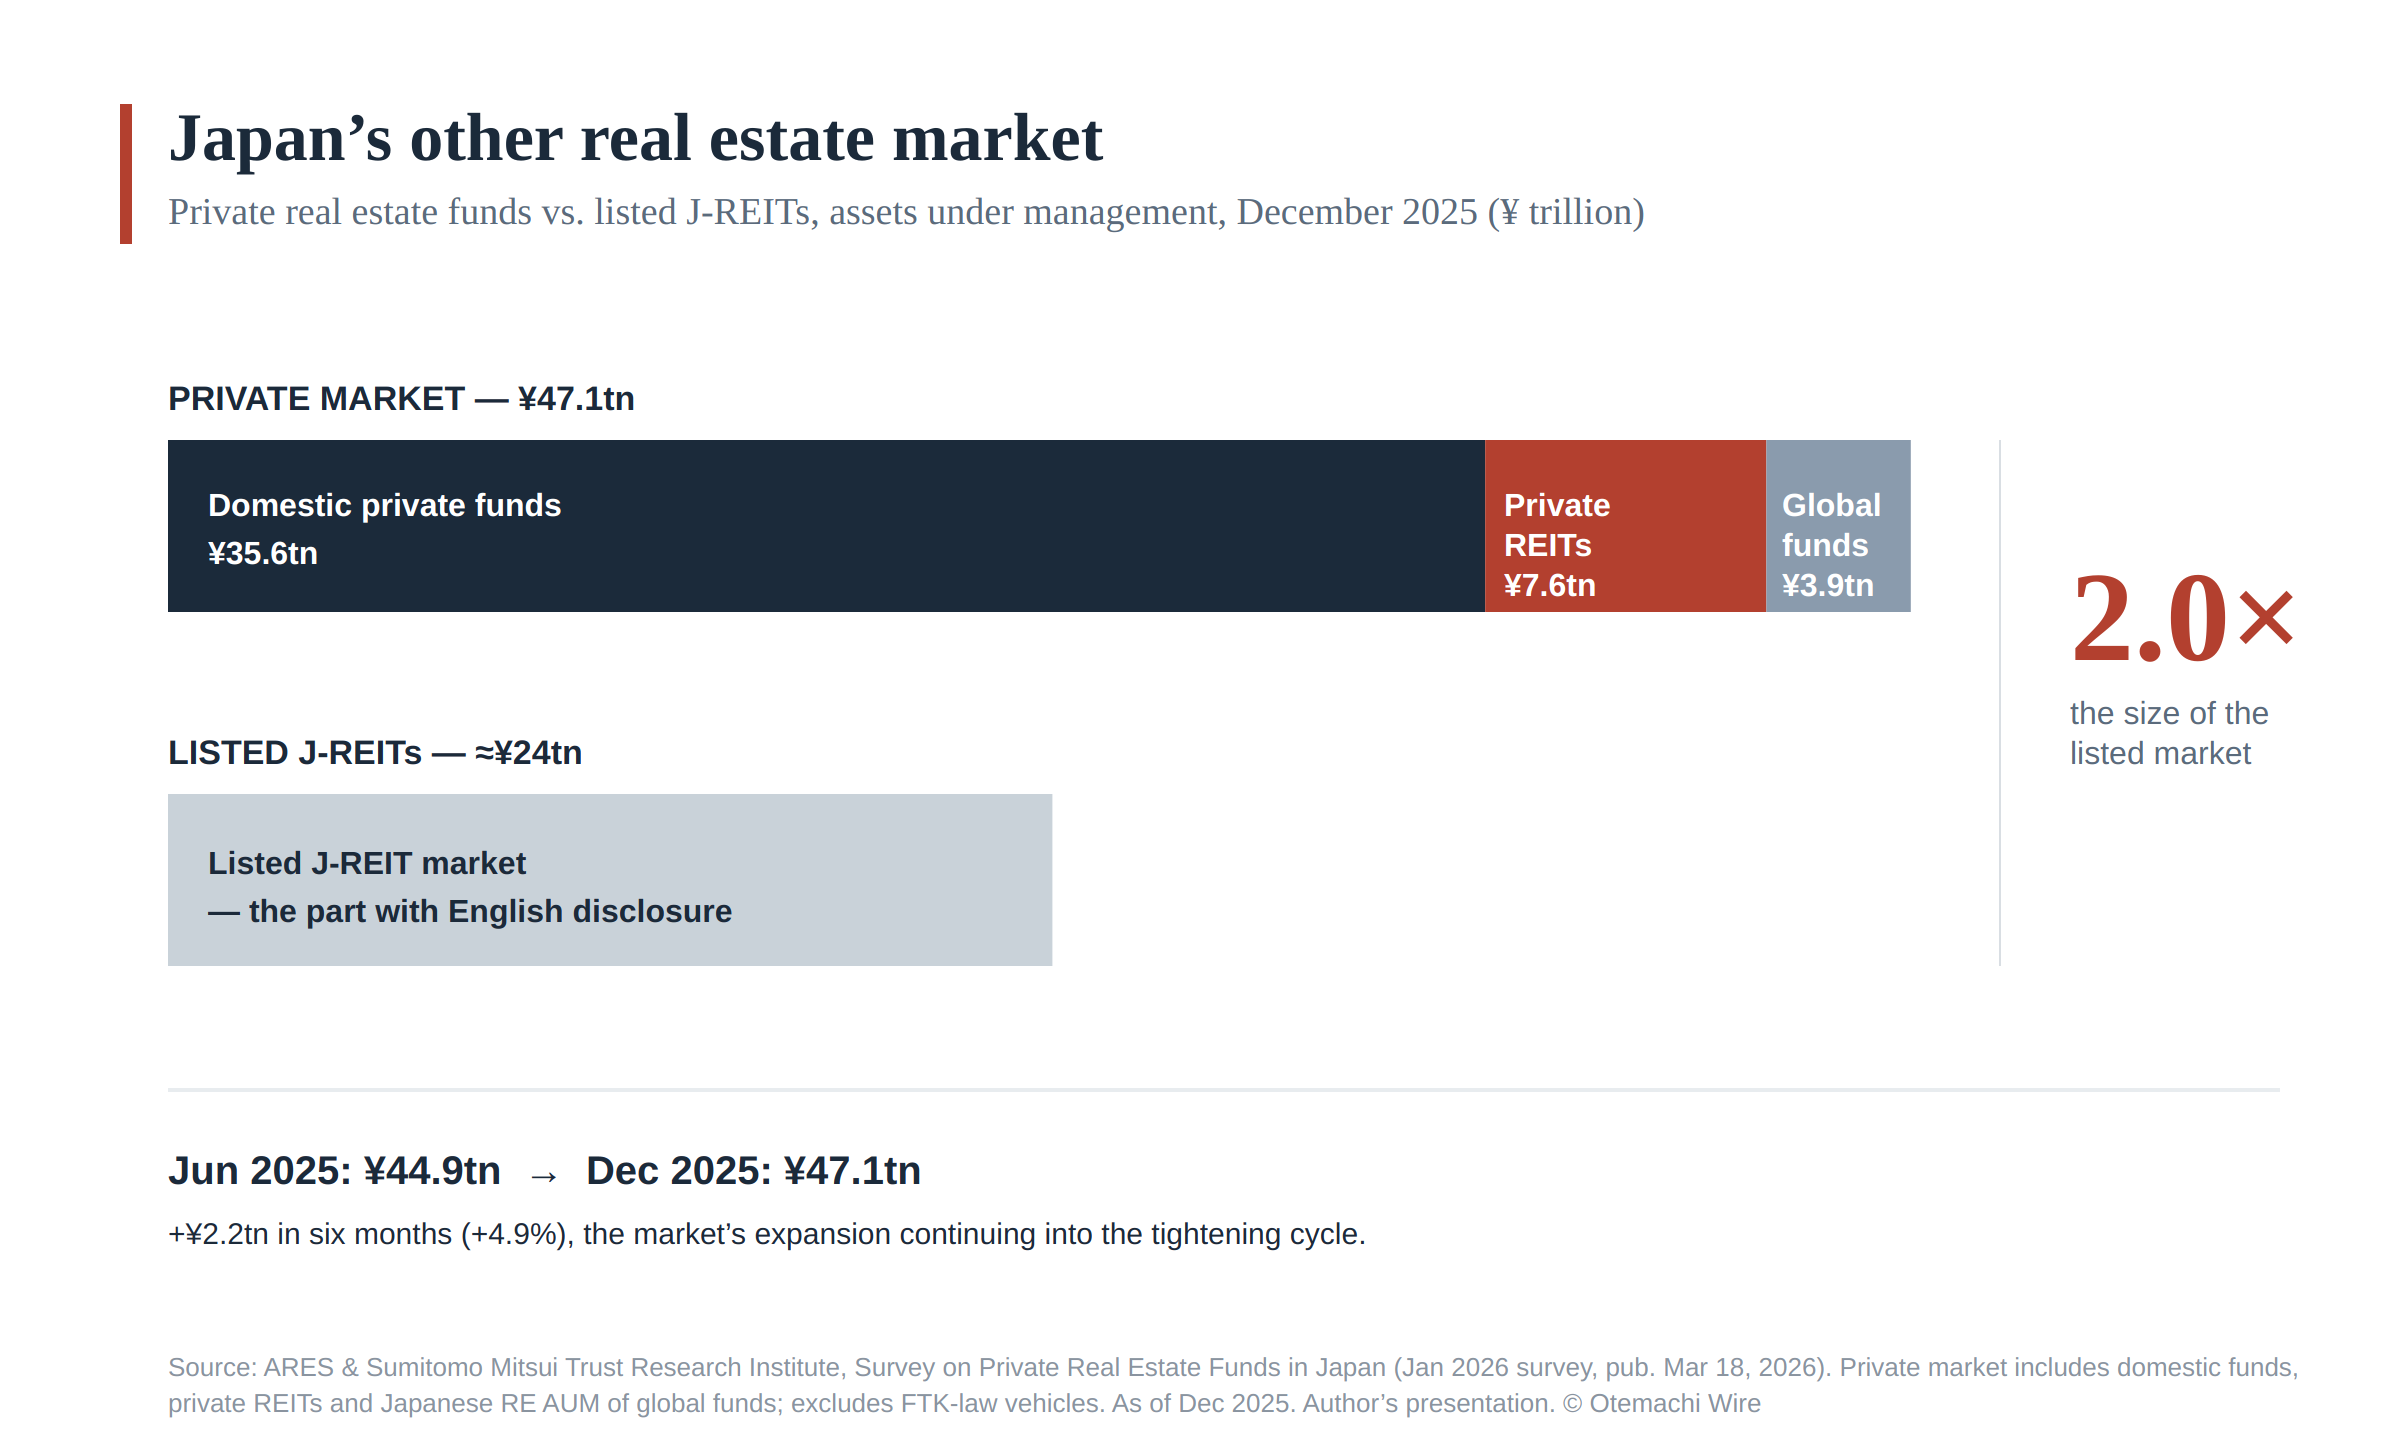
And yet it barely exists in English. There is no consolidated English database of its transactions. Its fund launches are reported in subscription-only Japanese trade journals that cannot be bought with a foreign credit card. Even the survey behind that ¥47.1 trillion figure — the closest thing this market has to an official census — is published in Japanese only. The information wall is not a metaphor. It is a business model — and, as the next chapter will show, tearing it down is nobody’s job.
This guide is a map of what is on the other side. It covers the three vehicles that structure the market, the sponsors and asset managers who run it, the pensions and regional banks that fund it, and the lenders who leverage it — and, in the final section, the places where all of this creates distortions that a patient investor can actually use. Nothing in it relies on non-public information. All of it relies on information that has simply never been translated.
Notes
¹ ARES & Sumitomo Mitsui Trust Research Institute, “Survey on Private Real Estate Funds in Japan” (January 2026 survey, published March 18, 2026; figures as of December 2025). The ¥47.1tn figure includes domestic private funds, private REITs, and the Japanese real estate AUM of global funds; it excludes vehicles under the Real Estate Specified Joint Enterprise Law (fudousan tokutei kyoudou jigyou). USD conversion at ¥150/$. J-REIT market size from the same survey’s historical series.
2. Why This Market Is Invisible in English
Chapter 1 claimed there is a wall. This chapter explains how it is built — because it was not built on purpose, and that is exactly why it is so durable.
Disclosure follows obligation, and obligation stops at the exchange. A listed J-REIT must disclose continuously, and the Tokyo Stock Exchange has spent years pushing listed issuers toward English. A private fund must disclose to its investors, full stop. Nothing in Japanese law requires a private REIT or a GK-TK fund to tell the public anything, in any language — so the only systematic record of what this ¥47 trillion market does is assembled by third parties: trade journals, industry associations, research houses. All of them work in Japanese, for Japanese subscribers, because that is where the paying readers are.
The trade press is the market’s memory, and it does not export. The specialist journals that track fund launches, property deals, and lender behavior are subscription products sold to the industry itself — some still ordered by fax, most payable only by domestic methods, none translated. This is not secrecy; it is a business model serving its actual customers. But the effect is that the market’s collective memory — who bought what, from whom, at what yield, financed by whom — exists only in a language and a distribution system that stop at the water’s edge.
The knowledge that matters most was never written down at all. Chapters 4 through 6 describe conventions — how appraisals really get made, which sponsors treat their REITs how, what a trust bank’s acceptance signals — that live in practitioners’ heads and in relationships, not in any document. Even a perfect translation engine has nothing to translate. This is the layer machine translation will never touch, and it is the layer where most of the mispricing in Chapter 11 originates.
And nobody’s job is to tear it down. Some on this side of the wall do earn from it — the opacity premium of Distortion 7, the subscriptions, the advisory fees from foreign investors renting local eyes. Most do not; they simply work in Japanese because their market does. But that is precisely the point: the wall needs no defenders, because dismantling it is nobody’s business model. Walls like that do not fall. They get doors cut into them — which is what this publication is.
3. The Three Vehicles: Listed J-REITs vs Private REITs vs Private Funds
Before the machinery, the map. Japanese institutional real estate lives in three wrappers, and every question in this guide — who buys, who lends, how things are priced — has a different answer depending on which wrapper you are standing in.
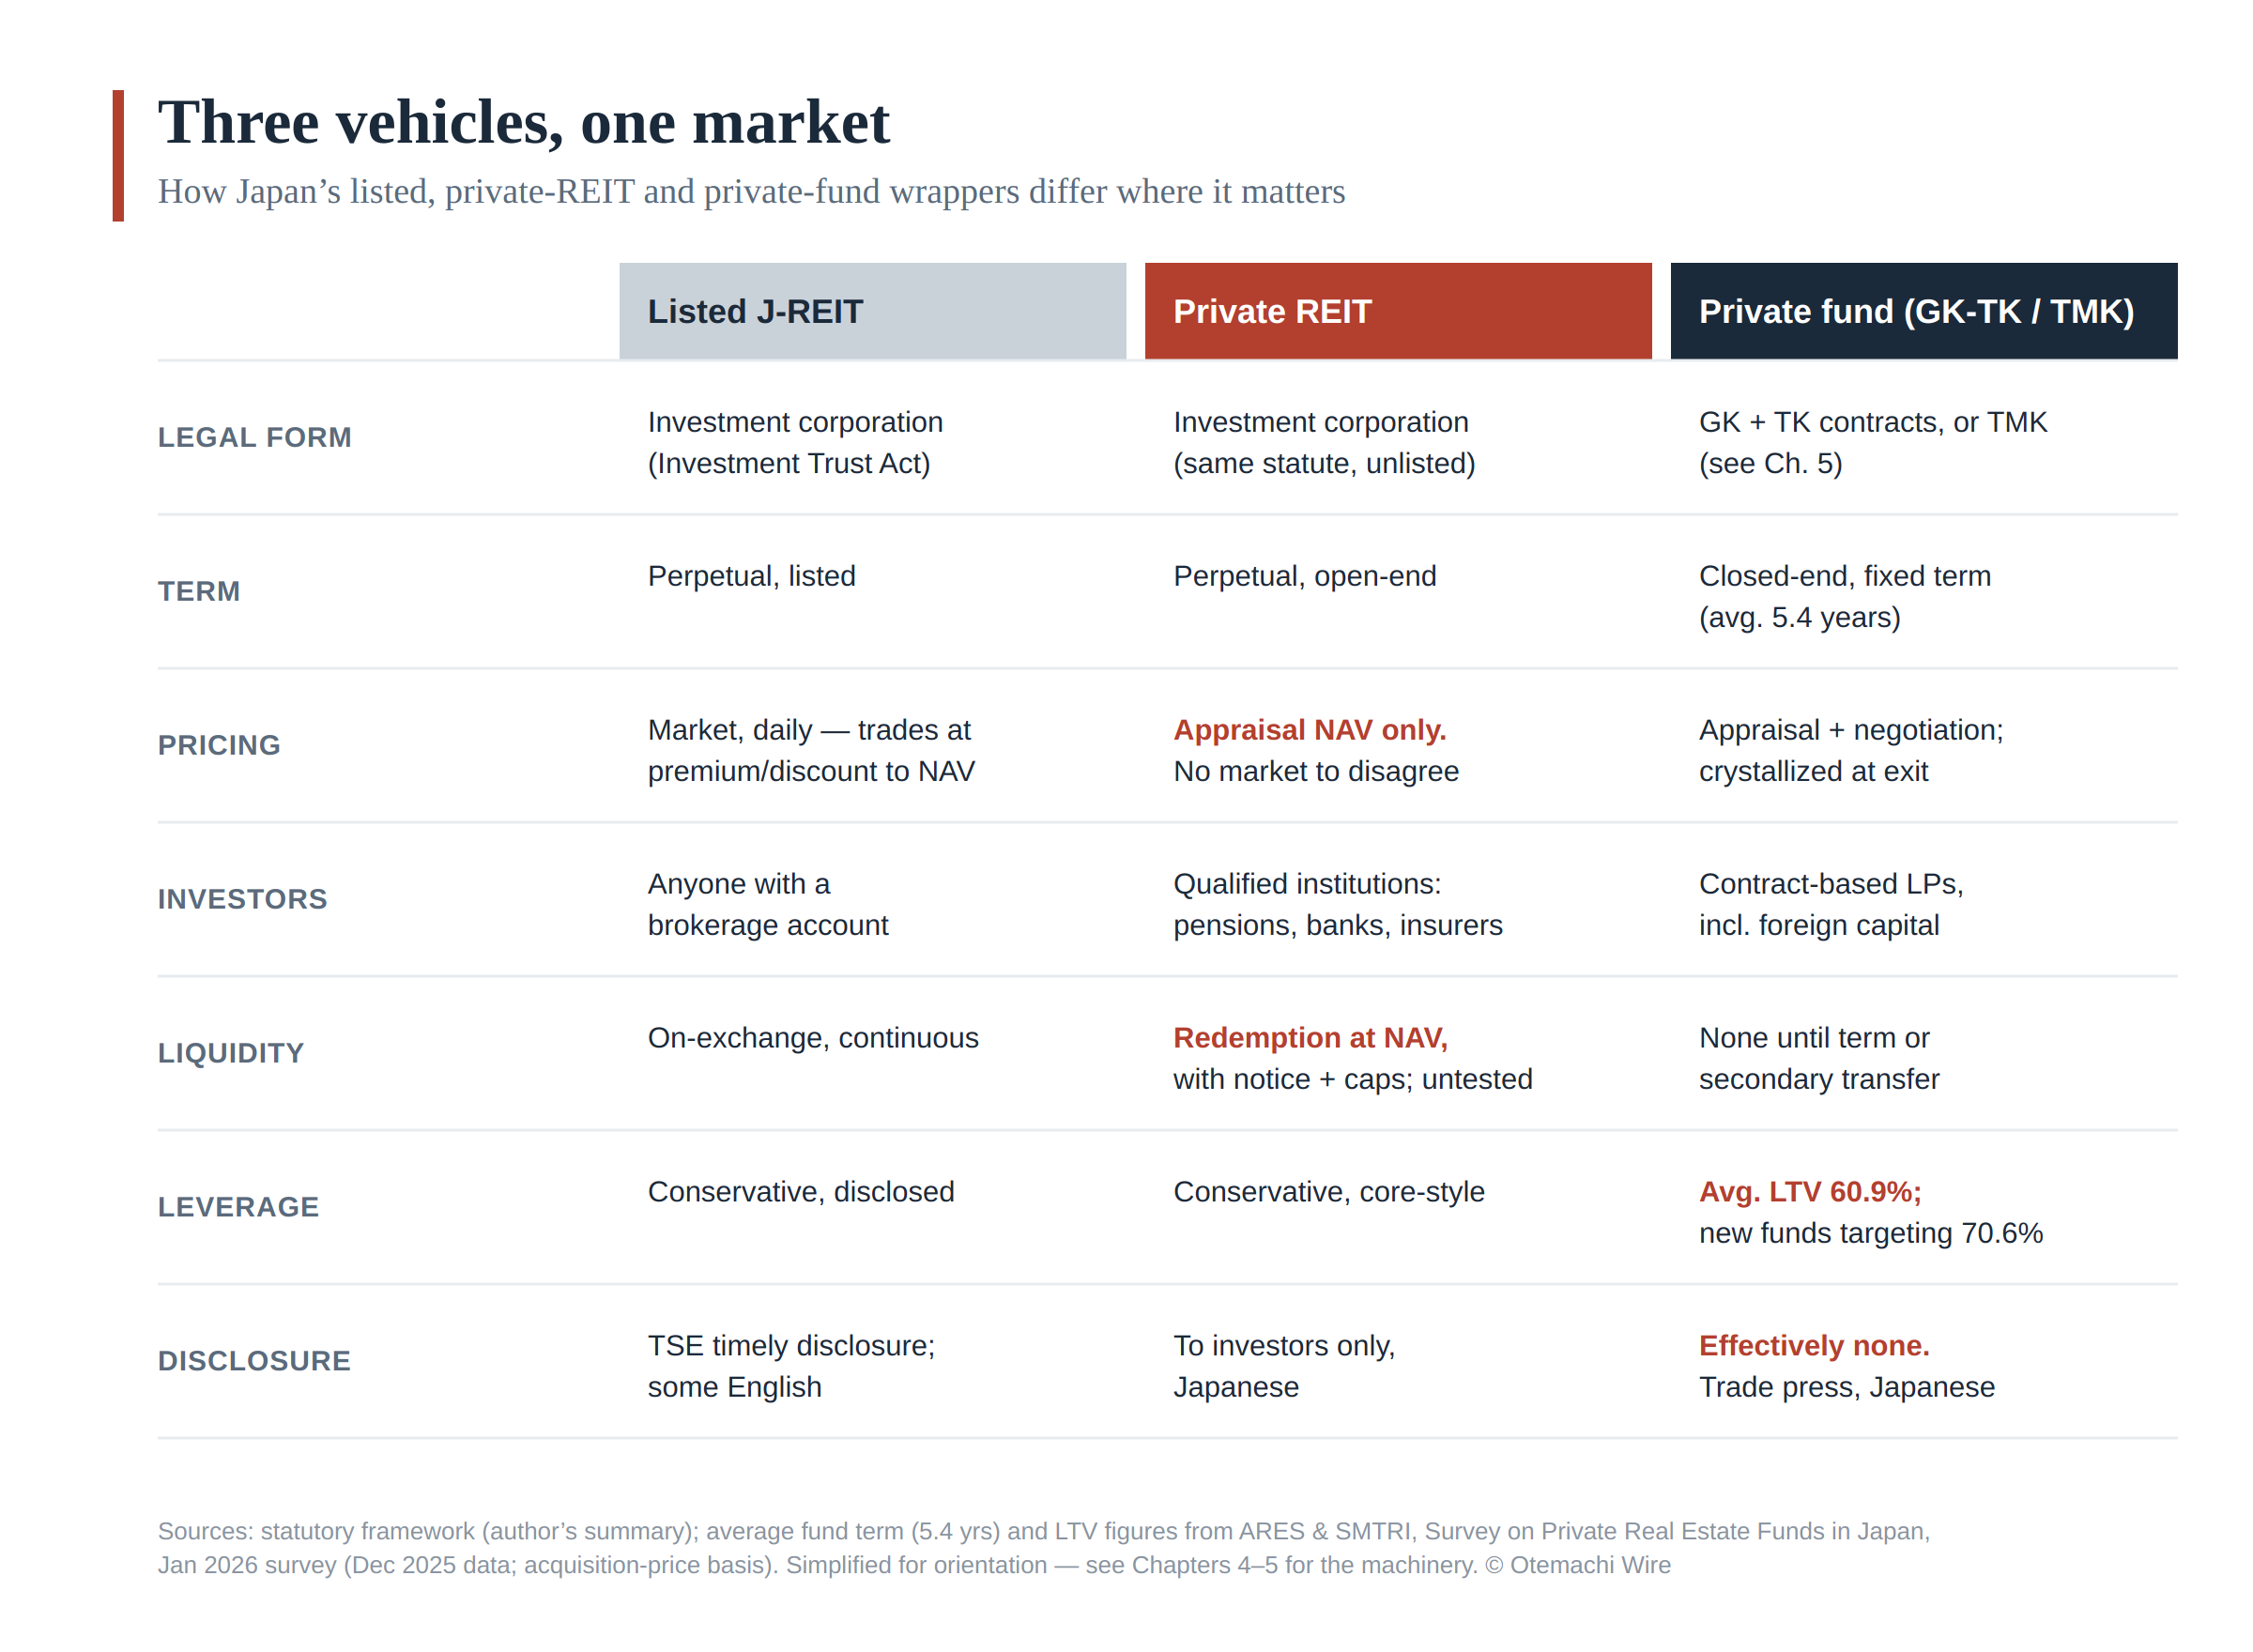
Read the table by its columns. The listed J-REIT is the transparent column: an investment corporation, perpetual, priced daily by the stock market, open to anyone, with exchange-mandated disclosure and some English. Roughly ¥24 trillion. It is the only column most foreign investors have ever seen — and, as Chapter 9 will show, its price and the other columns’ prices regularly disagree.
The private REIT is the same legal animal, unlisted: perpetual and open-end, but priced by appraisal instead of by a market, held by qualified institutions, redeemable with notice and caps. About ¥7.6 trillion, built in fifteen years. It exists because Japanese institutions wanted real estate without visible volatility — Chapter 4 is the anatomy of that bargain.
The private fund — GK-TK or TMK — is the closed-end workhorse: a fixed term averaging 5.4 years, contract-based investors including most foreign capital, leverage around 61% and rising, and effectively no public disclosure at all. Chapter 5 dissects its legal machinery. Together with the private REITs and global funds, this column is the ¥47 trillion majority of the market.
Three details in the table repay attention now, because the rest of the guide keeps returning to them. First, pricing: only one column has a market price; the other two run on the appraisal clock, which is the root of Distortions 1 and 2. Second, liquidity: the private REIT’s open-end promise sits on assets that take months to sell — untested machinery, per Chapter 4. Third, leverage: the closed-end column carries the most debt at exactly the wrong moment in the rate cycle, per Chapter 8. One market, three wrappers, three different sets of things that can go wrong. Now, the machinery.
4. Anatomy of a Private REIT (Shibo REIT)
The private REIT is the fastest-growing vehicle in Japanese real estate, and the easiest to misunderstand. The name invites a lazy translation — “like a J-REIT, but unlisted” — that misses everything important about it. A better description: a private REIT is an open-end, appraisal-priced real estate fund wrapped in the legal shell of an investment corporation, engineered to give Japanese institutions exactly what they want and almost nothing they are required to disclose.
As of December 2025, private REITs held roughly ¥7.6 trillion in assets — a segment that did not exist before 2010 and now accounts for about one-sixth of Japan’s entire ¥47.1 trillion private real estate fund market.¹
The machinery
Legally, a private REIT is the same animal as a listed J-REIT: an investment corporation (toshi hojin) under the Investment Trust Act, externally managed by an asset management company, typically sponsored by a developer, trust bank, or insurance group. What changes everything is one design choice: it is open-ended. There is no fixed term and no exit event. Investors — and only qualified institutional ones — subscribe and redeem at NAV, usually with notice periods, redemption caps, and in practice a heavy reliance on finding a replacement investor rather than selling buildings to fund the exit.
And that NAV is set not by a market, but by an appraiser. Unit prices are calculated from periodic kantei appraisals of the underlying properties. This is the single most consequential fact about the vehicle, and the rest of this chapter is essentially a study of its consequences.
The valuation clock
Japanese real estate appraisal is a discipline with its own conventions, and they matter here. Appraisals lean heavily on the income approach, on comparable transactions that are themselves appraisal-informed, and on cap rate assumptions that move slowly and by consensus. The result is a valuation series that is smooth by construction. When transaction markets reprice — in either direction — appraised values follow with a lag, in small steps.
For a listed J-REIT, this smoothness is background noise; the market prices the units daily anyway, and units happily trade at premiums or discounts to appraisal-based NAV. For a private REIT, the appraisal is the price. There is no market to disagree with it. An institution that buys in January and redeems in December has transacted, both times, at a number produced by the appraisal process — not by a clearing market.
Volatility, in other words, is not absent from a private REIT. It is unmeasured.
Why the money comes
This is precisely the point, and it is why the vehicle grew from zero to ¥7.6 trillion in fifteen years. Consider the buyers.
Japanese pension funds carry real estate in their alternatives bucket and answer to boards that measure risk as visible fluctuation — anything that never appears to fall in value is, by that yardstick, barely risky at all. An asset that yields 3–4%, never appears to fall in value, and carries a fiduciary-friendly investment-corporation wrapper is close to irresistible.
Regional banks hold vast deposit bases with shrinking lending opportunities. Under Basel rules and under the eye of the FSA, a stable, income-producing, low-reported-volatility security is a far easier position to hold — and to explain — than the same buildings held through a closed-end fund marked to a volatile exit value. For a decade of zero rates, private REIT units functioned as a yield product for bank treasuries as much as a real estate investment.
Life insurers get long-lasting, steady income that sits well against promises they must pay out decades from now — without quarterly price swings disturbing the accounts.
None of these investors is being fooled. They understand the appraisal lag perfectly well — many employ people who used to produce the appraisals. The smoothness is not a hidden defect of the product. It is the product.
The costs, and who pays them
The bill for smoothness arrives in three forms.
First, a liquidity mismatch. Open-end redemption promises sit on top of assets that take months to sell. In calm markets, subscriptions exceed redemptions and the mismatch is invisible. The mechanism has never been tested by a genuine redemption cycle in a falling market — the vehicle simply hasn’t existed through one. The global precedents (UK open-end property funds in 2016 and 2022, US non-traded REITs gating redemptions in 2022–23) are not encouraging, and the Japanese structure shares their core geometry.
Second, an entry/exit fairness problem. If appraised NAV sits below true market value in a rising market, redeeming investors are quietly subsidized by remaining ones; in a falling market, the transfer reverses. The slower the appraisal clock, the larger the transfer. This is a well-understood problem in any appraisal-priced open-end fund, and Japanese practitioners discuss it — in Japanese.
Third, a systemic observation rather than a cost: private REITs have become the owner that never has to sell. Because they are under no pressure to transact and their values move slowly, falling prices take much longer to become visible to everyone else. Some of the celebrated stability of Japanese commercial real estate is real — leases are long, tenants stay, financing is cheap. And some of it is an artifact of who owns the buildings and how those owners mark them. Distinguishing the two is one of the recurring projects of this newsletter.
What to watch
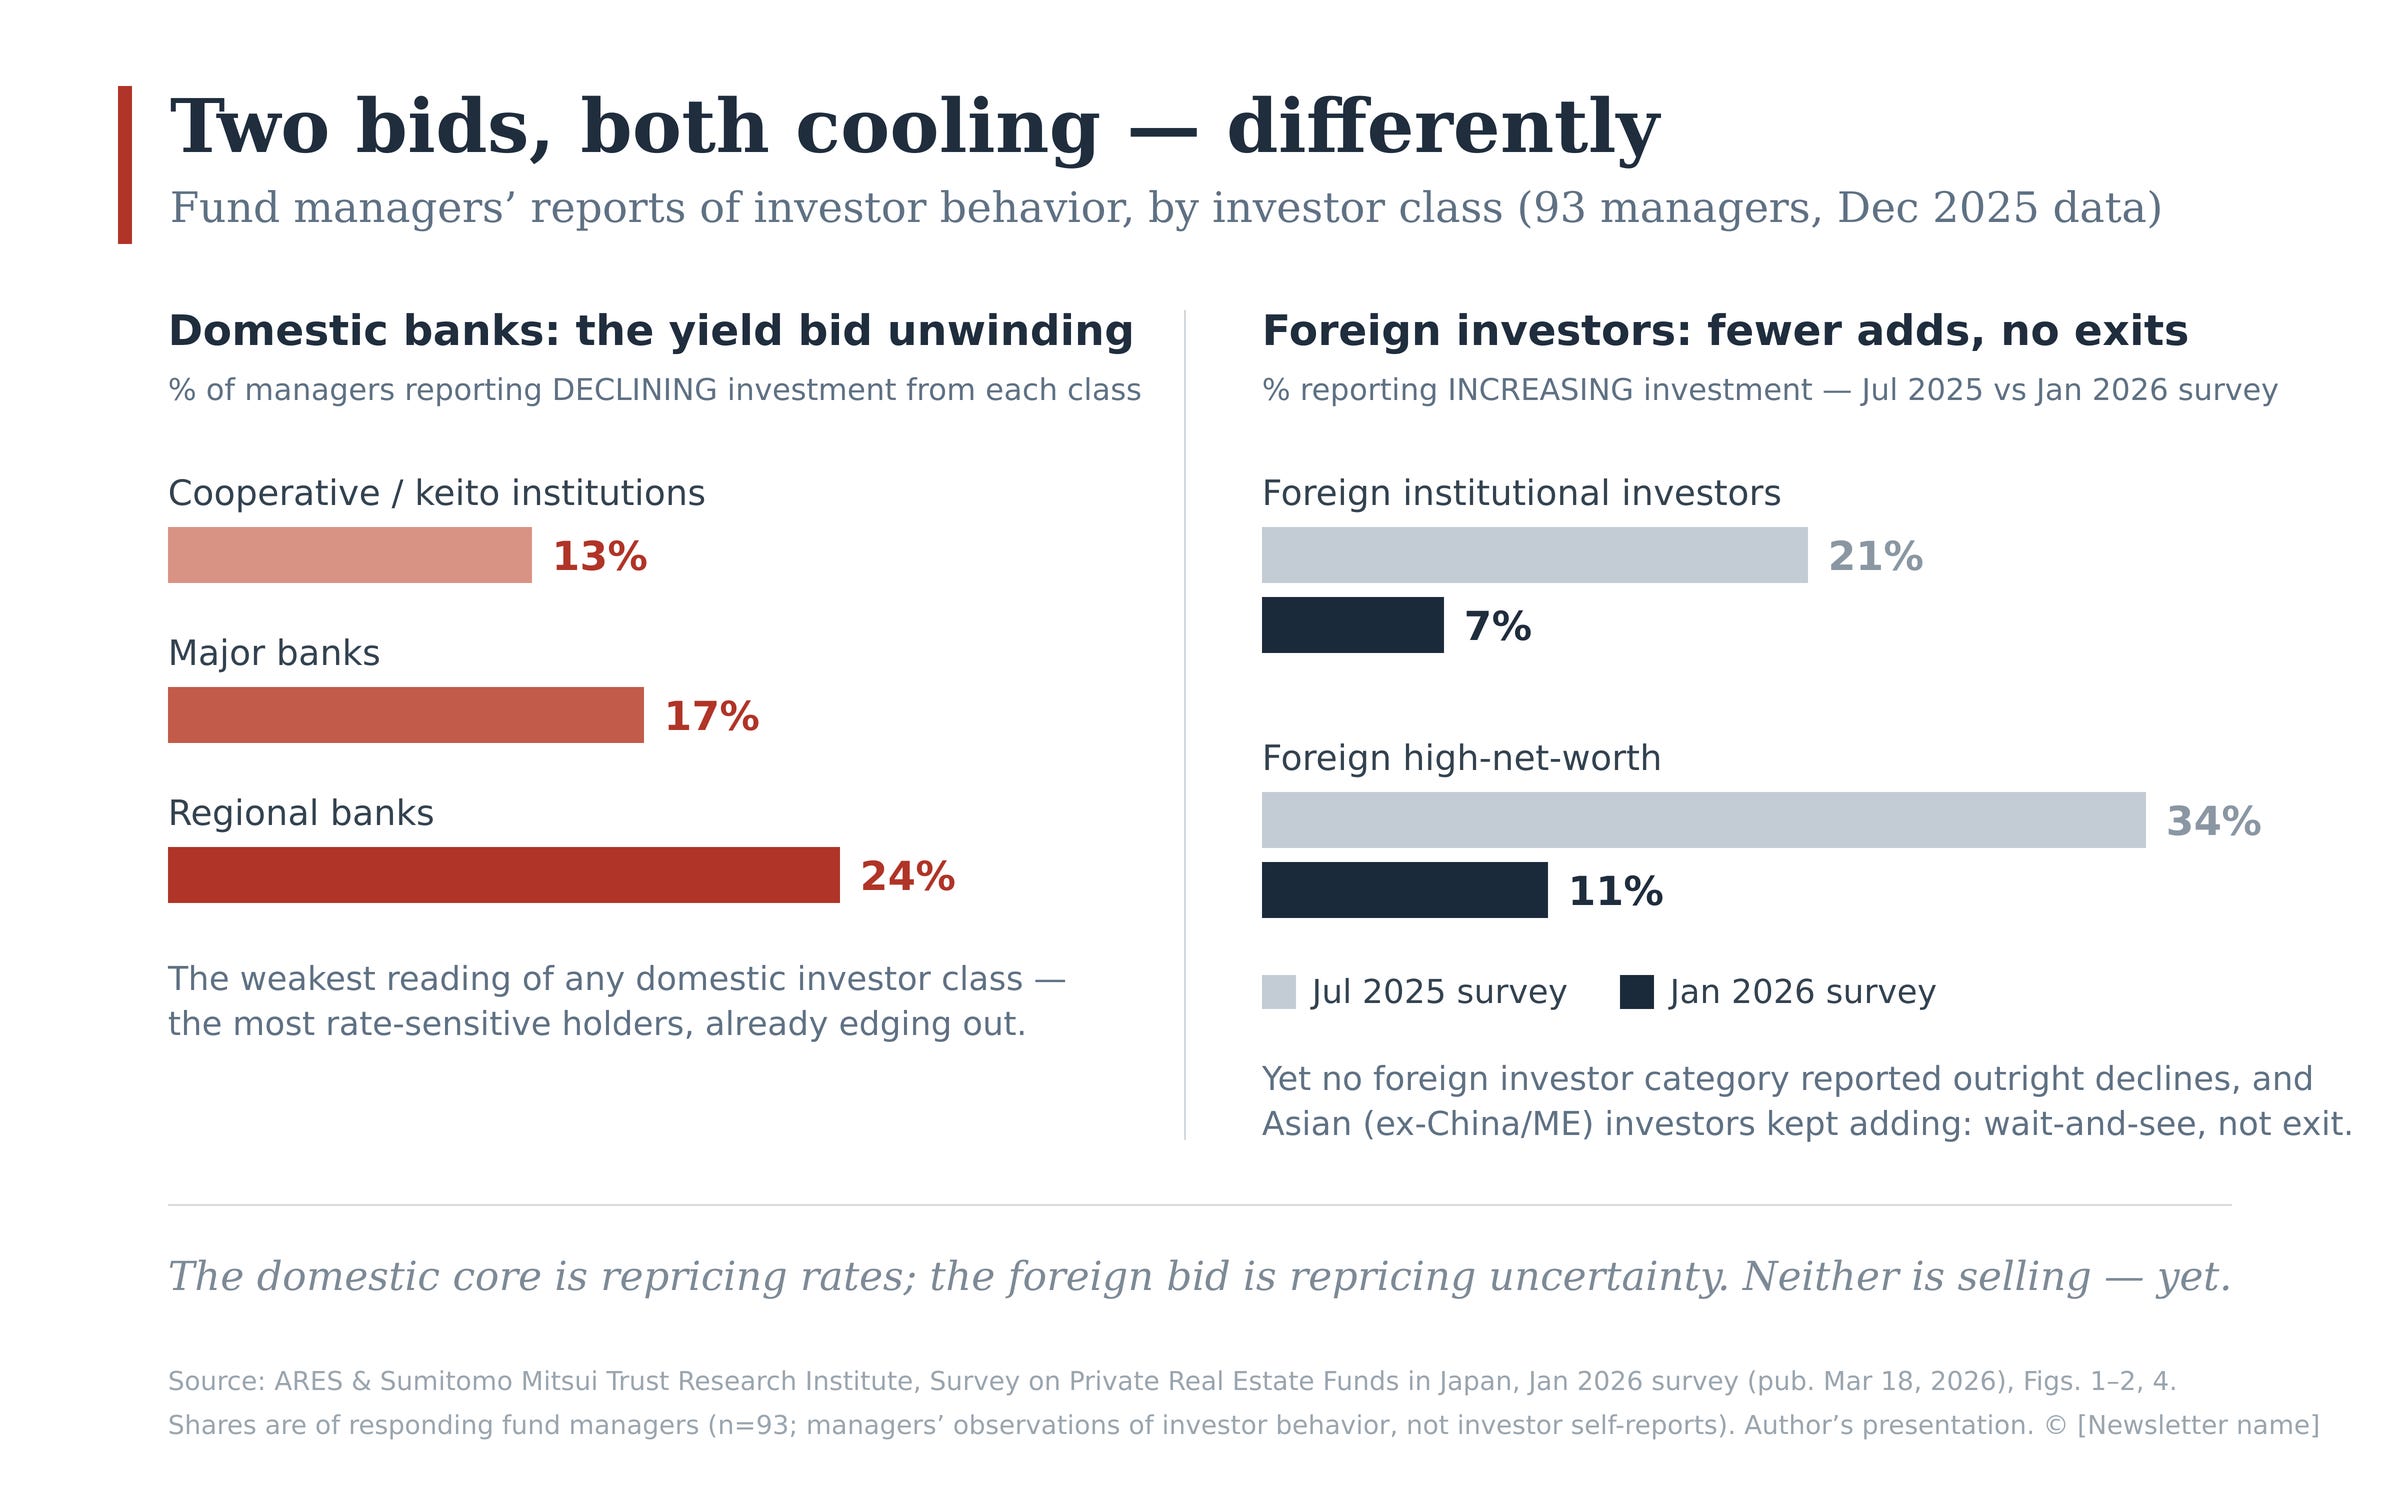
The stress test, if it comes, will not announce itself in the NAV. It will show up earlier in three places: redemption notice volumes and any use of caps or queues; the gap between private REIT appraisal cap rates and the implied cap rates at which listed J-REITs trade; and the behavior of the regional banks, who are both equity holders and, per the January 2026 ARES/SMTRI survey, the investor group already showing the most caution — 24% of surveyed fund managers reported declining investment amounts from regional banks, the weakest reading of any domestic investor class.² When the most rate-sensitive holders of the most liquidity-mismatched vehicle start heading for the door at the same time, appraisal smoothing stops being a feature and becomes a queue.
Notes
¹ Association for Real Estate Securitization (ARES) & Sumitomo Mitsui Trust Research Institute (SMTRI), “Survey on Private Real Estate Funds in Japan,” January 2026 survey (published March 18, 2026; figures as of December 2025). Private REIT AUM of ¥7.6 trillion and the total private fund market size of ¥47.1 trillion are from the survey’s market-size estimate, which includes domestic private funds, private REITs, and the Japanese real estate AUM of global funds, and excludes vehicles under the Real Estate Specified Joint Enterprise Law. Japan’s first private REIT began operations in 2010. The survey is published in Japanese only.
² Ibid., Figure 2 (equity investor investment amounts by investor type). Respondents are fund management companies (93 responding firms; effective response rate 63.6%), reporting on investment amounts by investor class.
5. Anatomy of a GK-TK Structure and TMK
If the private REIT is the vehicle Japanese institutions buy, the GK-TK is the vehicle everyone else builds. It is the workhorse of Japanese private real estate — the default wrapper for closed-end funds, club deals, and a large share of domestic acquisitions — and it is almost perfectly incomprehensible from the outside. The names do not help: a godo kaisha holding assets, financed through tokumei kumiai agreements, holding not buildings but trust beneficiary interests in buildings. Three layers of Japanese legal machinery where a Delaware LP would use one.
None of this is decoration. Every layer exists because it dissolves a specific Japanese regulatory, tax, or commercial problem, and once you see the problems, the structure stops looking baroque and starts looking inevitable. This chapter walks through the machine twice — once for the GK-TK, once for its statutory cousin, the TMK — and then explains the single question that decides which one gets used.
The GK-TK, layer by layer
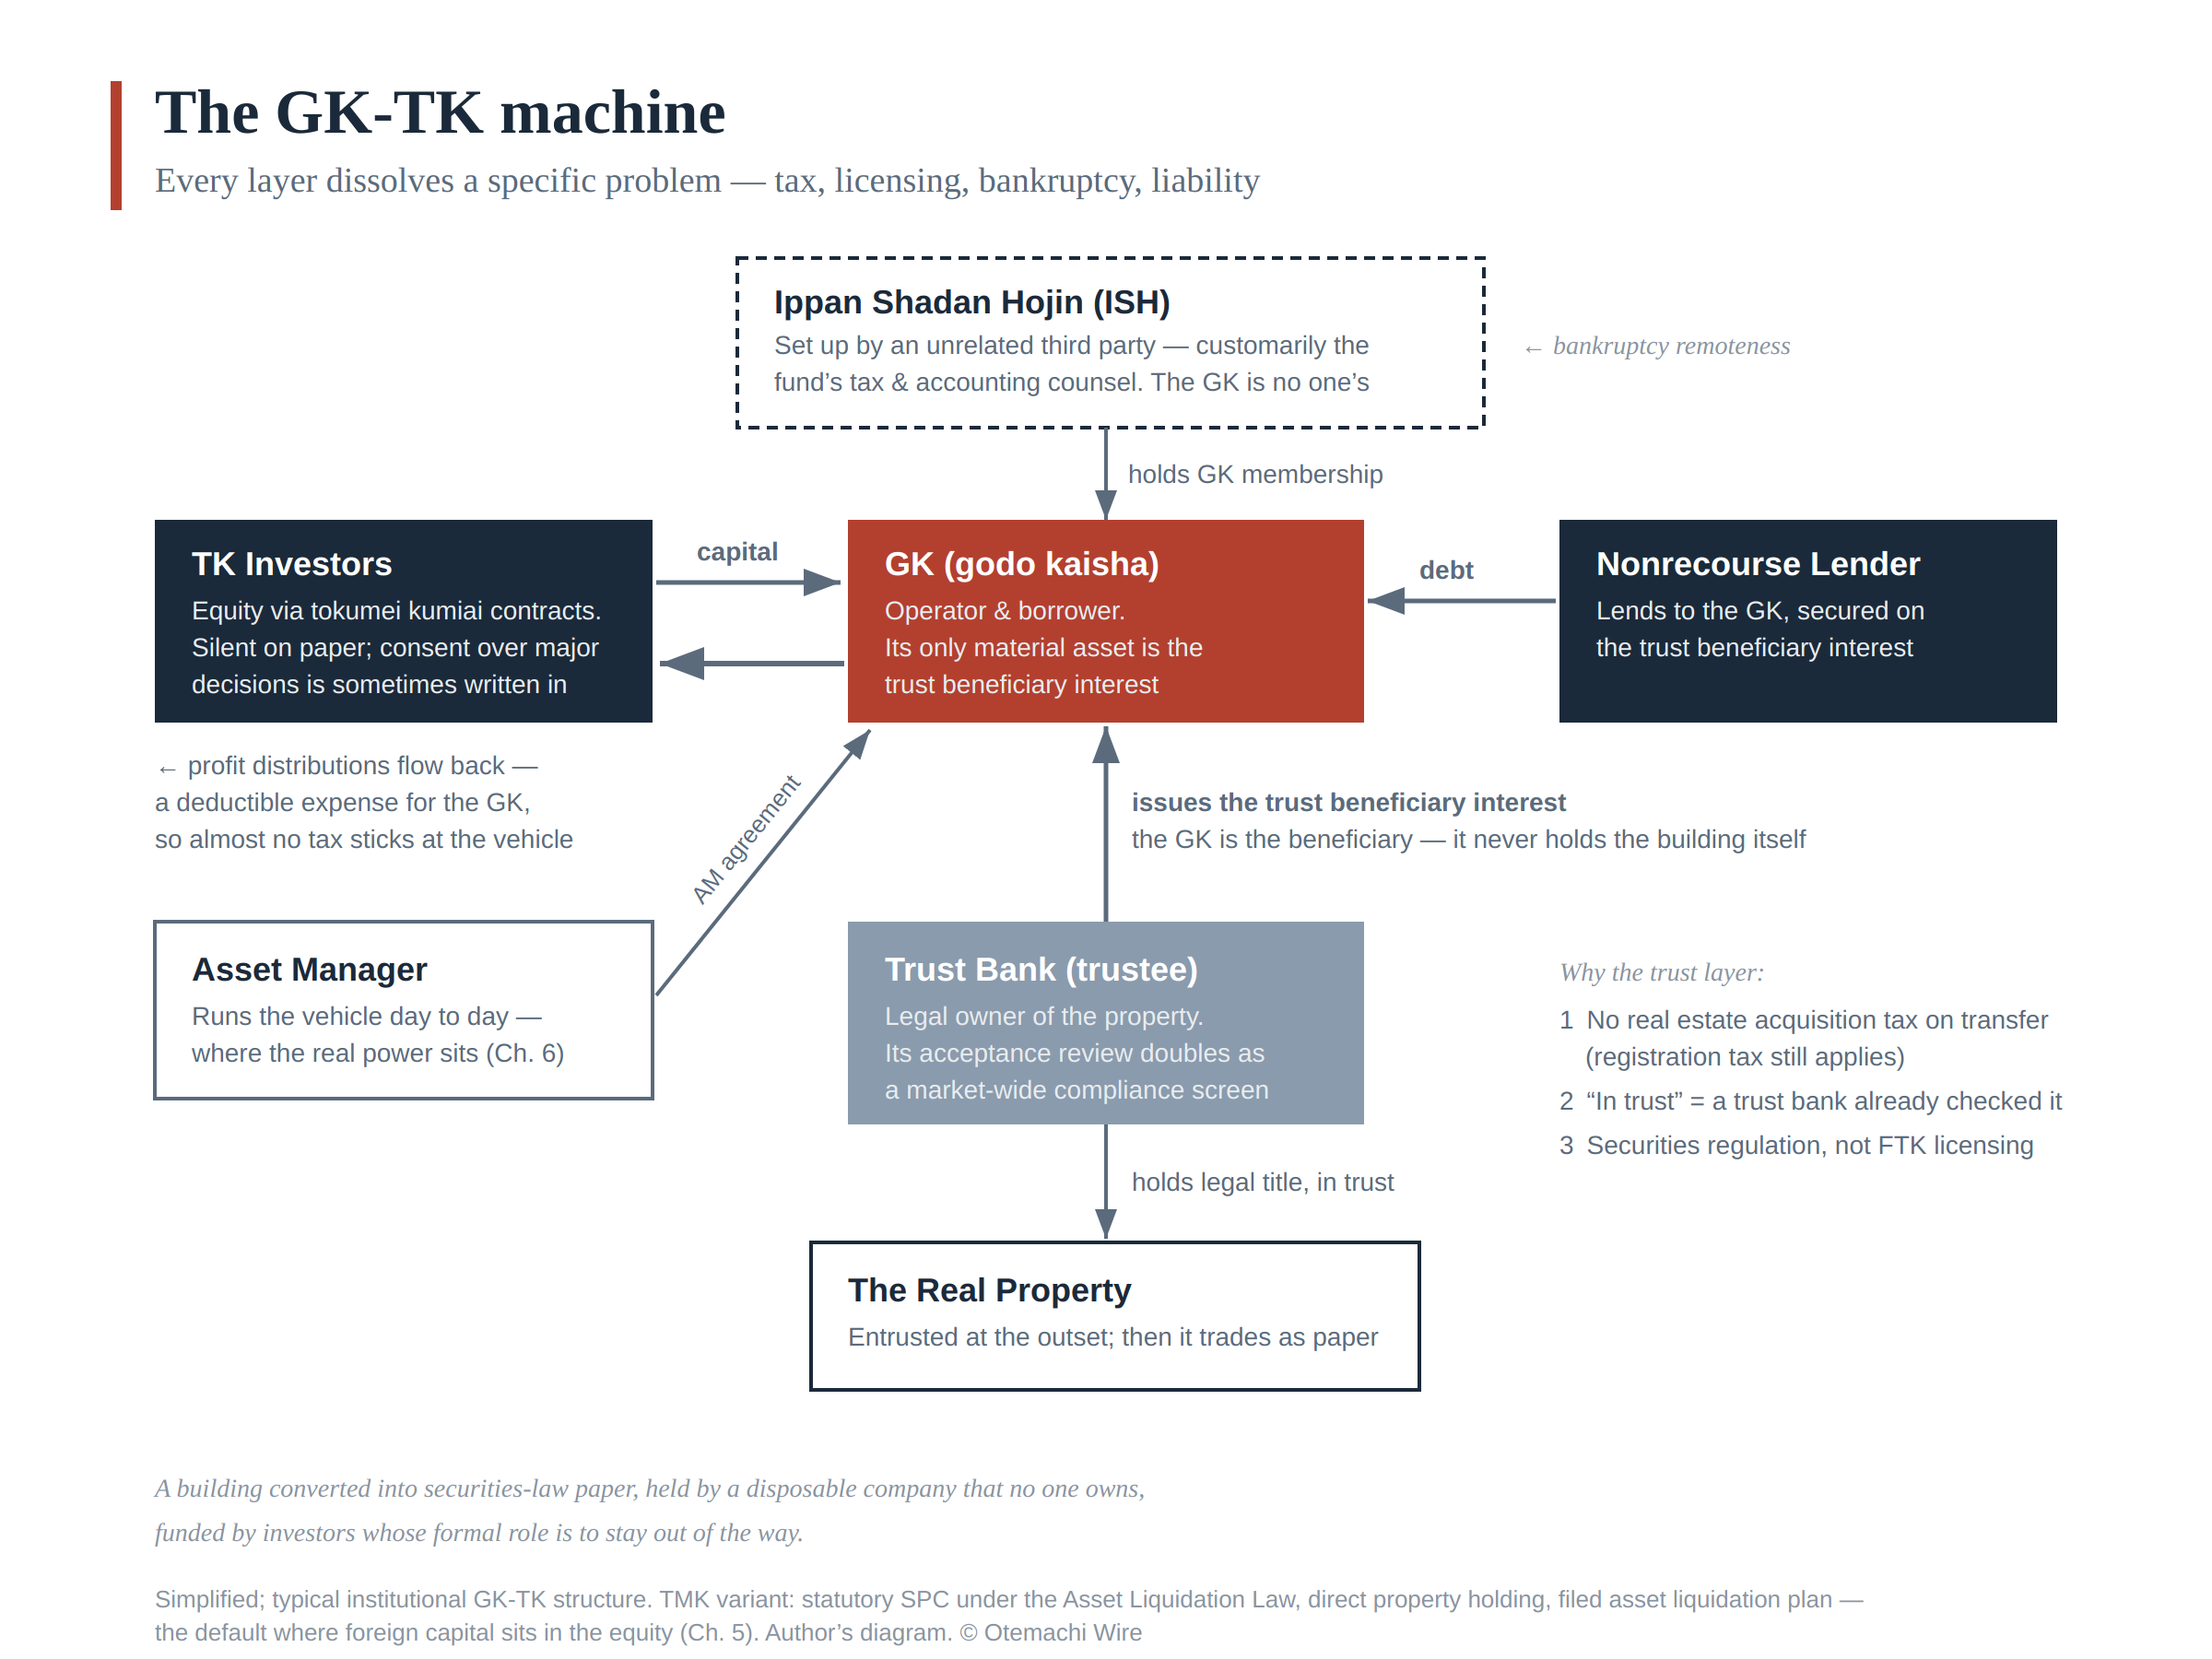
Start at the bottom and build upward.
The building goes into a trust. Before anything else happens, the property is typically entrusted to a licensed trust bank, which issues a trust beneficiary interest (shintaku juekiken) — a claim on the trust’s cash flows. The fund vehicle will own this paper, not the building. Foreign investors routinely read this as an exotic flourish. It is the opposite: it is load-bearing, three times over. First, transfer taxes: selling a building triggers real estate acquisition tax; transferring a beneficiary interest does not — registration tax, by contrast, is not exempt — which in a market where the same asset may change hands among funds every few years is not a detail but a material slice of returns. Second — and this is the part no textbook mentions — the trust bank’s own acceptance review functions as a market institution. A trust bank will not take a property into trust without vetting its legal compliance, and so the fact that an asset is in trust operates as a due-diligence signal: buyers and lenders read “trust beneficiary interest” partly as “a trust bank has already checked this.” Third, regulatory classification: a beneficiary interest is a security-like instrument under the Financial Instruments and Exchange Act, keeping the fund outside the licensing regime of the Real Estate Specified Joint Enterprise Law and inside the securities framework the industry is built to operate in. Tax, signal, regulation — one conversion, three problems dissolved.
The paper is held by a GK. The godo kaisha is Japan’s closest analogue to an LLC: cheap to form, flexible to govern, no board required. It is the titleholder and the borrower. Nonrecourse lenders lend to it; by design, its only material asset is the trust beneficiary interest.
The equity arrives through TK agreements. The tokumei kumiai — literally “anonymous partnership,” a structure with roots in the Commercial Code older than most of the industry using it — is a bilateral contract under which an investor contributes capital to the GK’s business and receives a share of profits. Two features make it the industry standard. First, tax: TK profit distributions are deductible expenses for the GK, leaving minimal tax at the vehicle level — pass-through economics achieved by contract rather than by entity classification. Second, liability: the TK investor’s exposure is capped at its contribution. The price of both features is, on paper, the “anonymous” part: the TK investor is not supposed to run the GK’s business. Foreign LPs sometimes read this as a governance void. In practice it is softer than the statute sounds — writing major decisions into the TK agreement as matters requiring the investor’s consent is commonly requested and granted, investor by investor, and Japanese fund counsel do not, in day-to-day practice, treat them as a threat to TK characterization. The real tilt in the structure is quieter: whatever consent rights sit in the contract, the running of the vehicle — operating decisions, information flow, timing — lives with the asset manager and the sponsor. The passivity is less a legal cage than a default setting, and defaults, in governance as in software, are where the power is.
Above the GK sits a general incorporated association. The GK’s membership interests are typically held not by the sponsor but by an ippan shadan hojin — an orphan entity with no owner, administered by independent members. This is the bankruptcy-remoteness keystone: it ensures that if the sponsor fails, no creditor of the sponsor can reach through and drag the GK — and the lender’s collateral — into the sponsor’s insolvency. Combined with non-petition covenants and the trust wrapper itself, the result is a vehicle that is, in insolvency terms, an island.
Seen whole: a building converted into securities-law paper, held by a disposable company that no one owns, funded by investors whose formal role is to stay out of the way. Every piece answers a question Japanese law or Japanese practice asks. No piece is optional once you know the questions.
The TMK: the statutory alternative
The tokutei mokuteki kaisha is what the GK-TK would look like if the government designed it — because it did. Created under the Asset Liquidation Law, the TMK is a special-purpose company with its own statutory regime: it files an asset liquidation plan with the authorities, issues preferred equity and specified bonds, and in exchange receives its own tax privilege — dividends paid become deductible, provided the TMK satisfies its conduit conditions, including distributing the bulk of its distributable profits. It can also hold real property directly, with no trust conversion required.
The practical differences from a GK-TK begin with weight. A TMK must file — and amend — an asset liquidation plan with the authorities, and the setup carries a longer runway and heavier ongoing administration. Domestic players, who prize speed and have no discomfort with the GK-TK’s conventions, tend to avoid the TMK for exactly this reason. But the GK-TK has a feature that reads very differently from abroad: at the top of the structure sits a GK owned by an orphan association — a company that is, deliberately, no one’s. Domestic participants see bankruptcy remoteness; foreign investment committees see an entity whose ownership they cannot draw on an org chart. The result is one of the quiet sorting rules of the Japanese market: deals with foreign capital in the equity are structured as TMKs far more often than not, while all-domestic deals default to GK-TK. The same design choice — ownerlessness — that solves the insolvency problem creates the trust problem, depending on who is looking. A TMK’s statutory wrapper, filed plan, and defined securities give a foreign investment committee something it can read, check, and approve. That, more than any tax nuance, is what decides the question.
Why this matters to anyone who doesn’t practice law
Three reasons, in ascending order of consequence.
First, reading deal flow requires reading structures. When a trade journal reports that an ippan shadan hojin or a numbered GK acquired a tower in Toranomon, that is not the buyer; it is the buyer’s shadow. Learning to see through the wrapper to the sponsor, the equity, and the lender behind it is the basic literacy of the Japanese private market — and one of the recurring services of this newsletter. The wrapper itself is information: a TMK in the chain is, more often than not, the footprint of foreign money.
Second, the structure shapes behavior. Whatever the contract says, the day-to-day of a GK-TK lives with the asset manager and sponsor — which is one more reason the sponsor dynamics of Chapter 6, and the conflicts of Distortion 3, matter more in Japan than a governance checklist would suggest. The wrapper is not neutral; it tilts the table.
Third, the machinery is a moat with a toll gate. None of this is secret — the statutes are public, the structures are standard — but the operating knowledge of how the pieces fit, which lenders accept which variations, and where the practice diverges from the statute lives almost entirely in Japanese legal memos and deal precedent. That knowledge asymmetry is priced, as Distortion 7 argued. The investors who cross it do so by renting it — counsel, asset managers, advisors — or by reading it. This chapter was the map; the toll gate is lower than it looks.
Notes
¹ Transfer-tax treatment: acquisitions of real property attract real estate acquisition tax (fudousan shutoku zei) and registration and license tax at materially higher effective rates than transfers of trust beneficiary interests; the differential is a standard motive for holding institutional assets in trust form.
² Under a tokumei kumiai agreement (Commercial Code Arts. 535 et seq.), profit distributions to TK investors are deductible for the operator (eigyosha); the TK investor’s liability is limited to its contribution.
³ TMKs are formed under the Act on Securitization of Assets. Conduit treatment (deductibility of dividends) is subject to statutory conditions, including distribution of more than 90% of distributable profits and requirements concerning the offering of its securities.
6. The Players: Who Runs This Market
Chapters 4 and 5 described vehicles. Vehicles do not buy buildings; organizations do. This chapter is about the organizations — who they are, where their people come from, and why the org chart behind a fund predicts its behavior better than its prospectus does.
The sponsor system
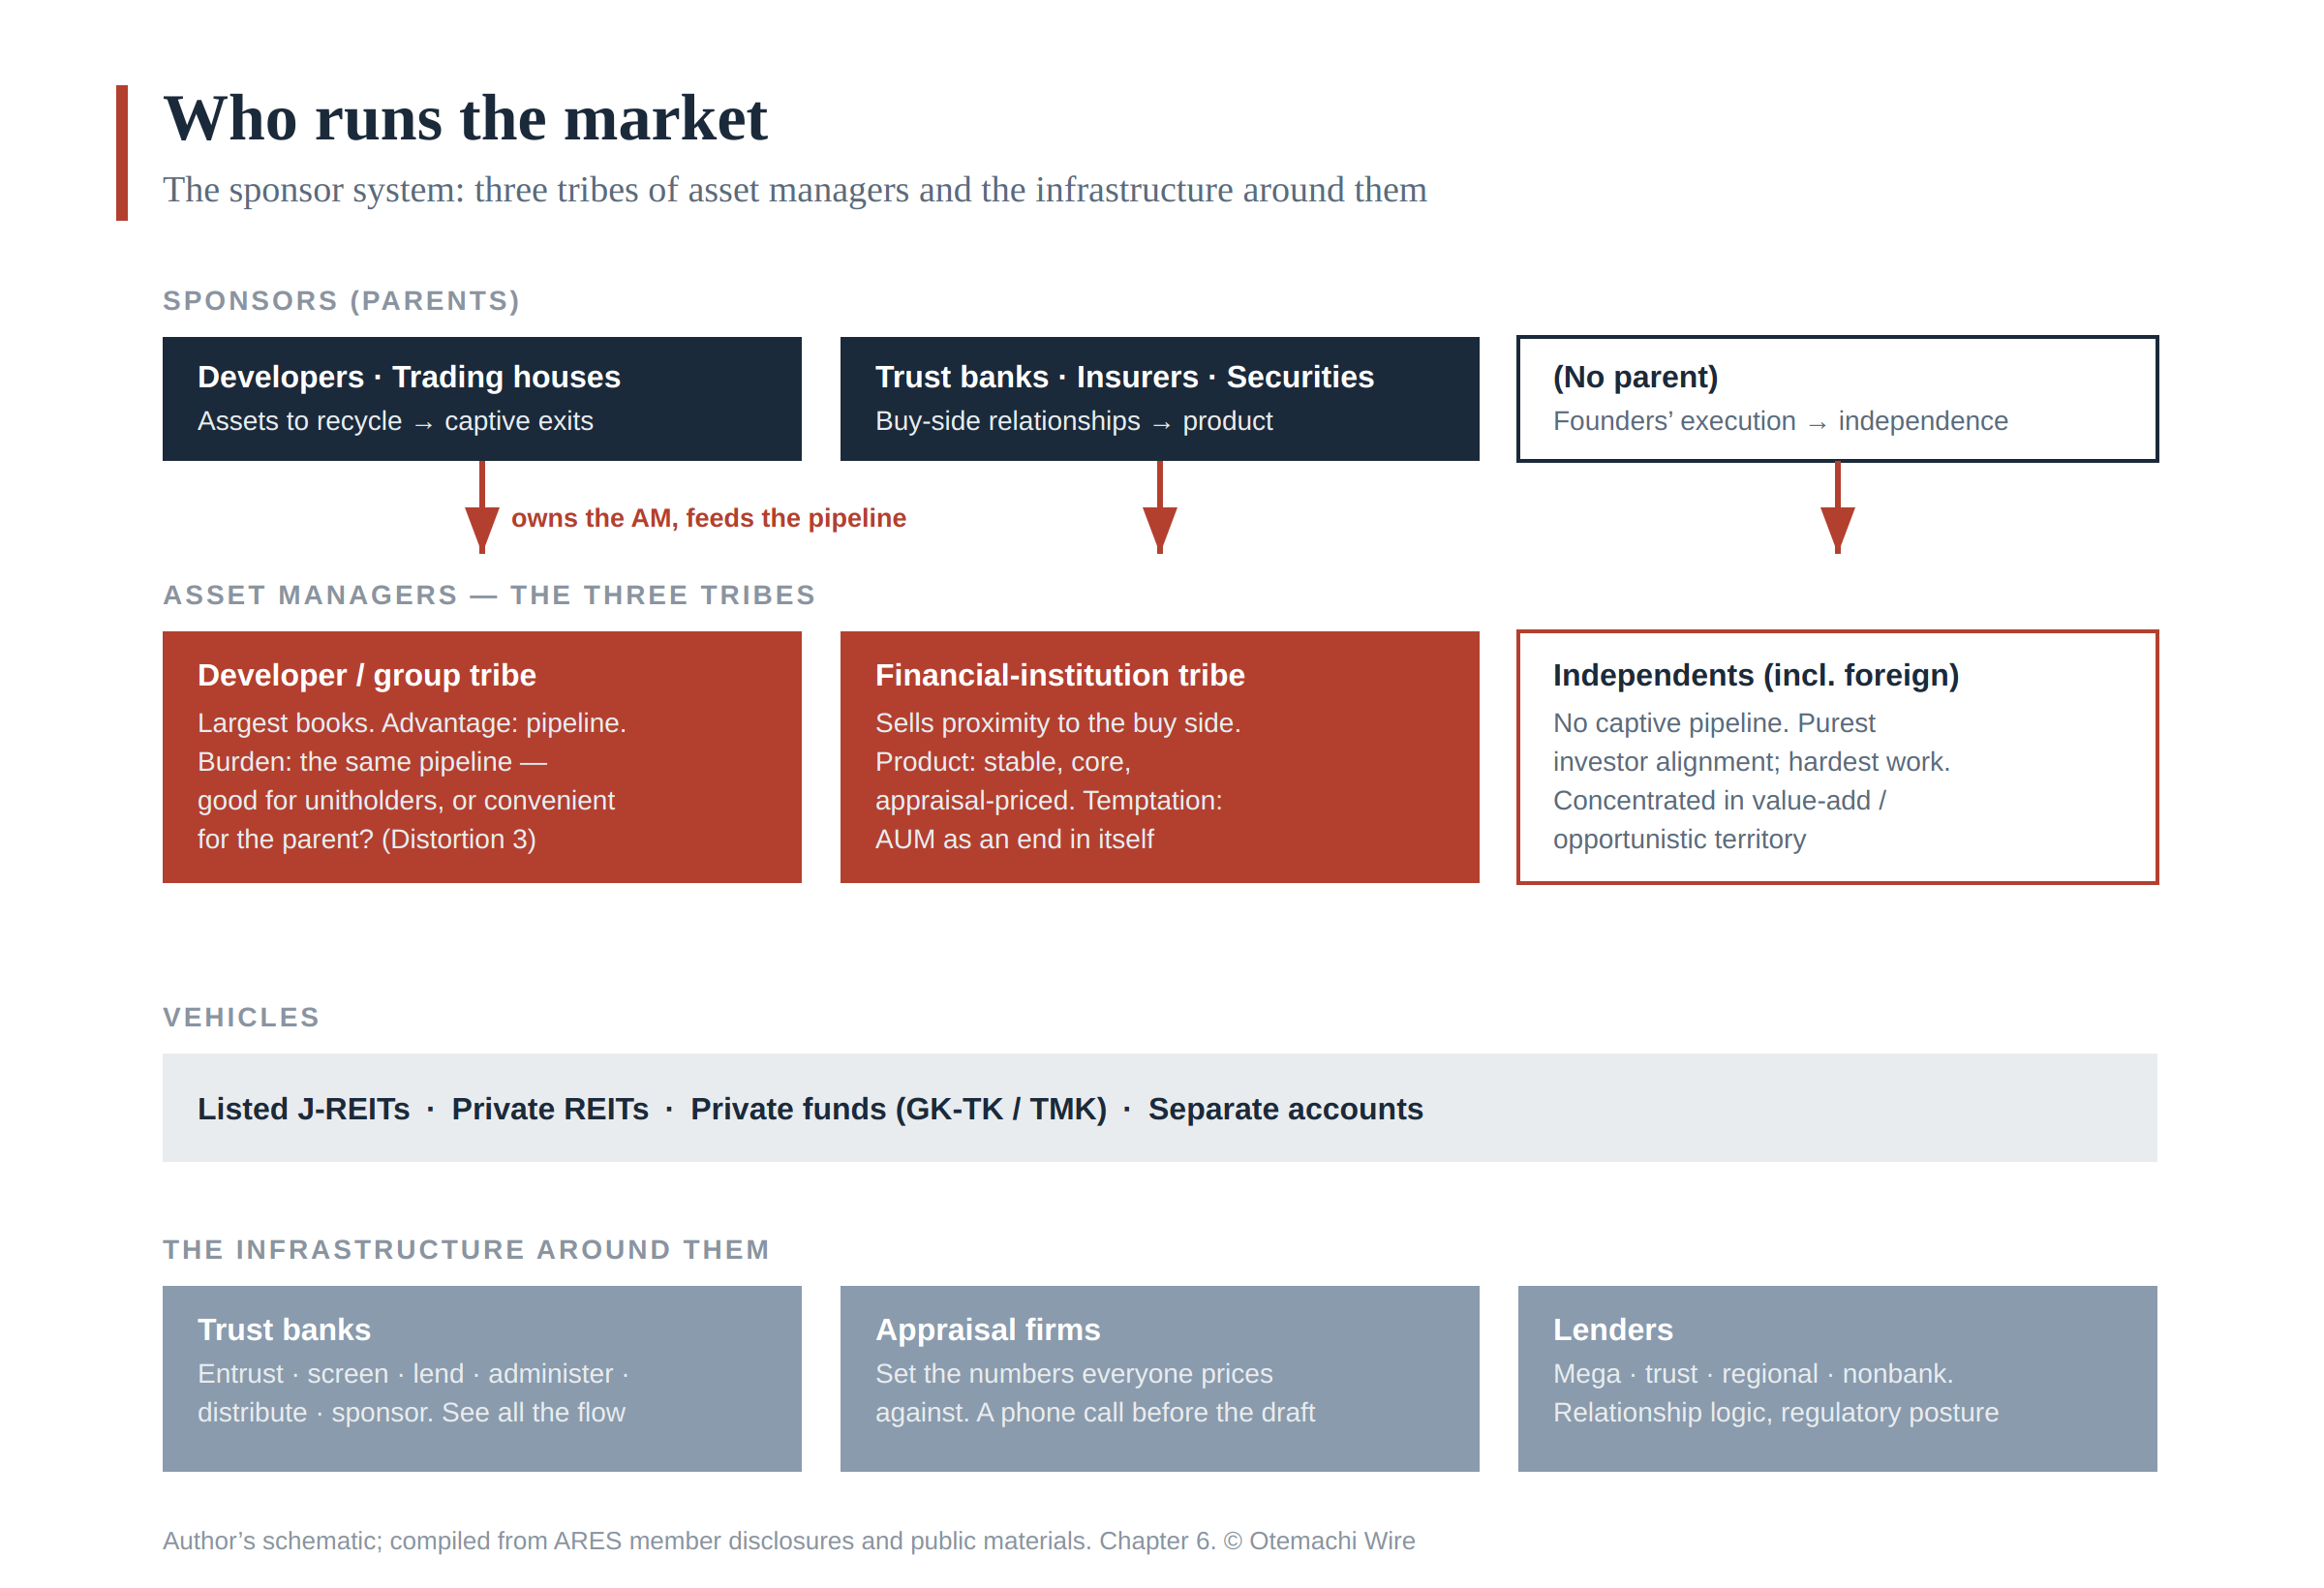
The single most important fact about the Japanese asset management industry is that most of it is owned. The typical manager of a private REIT or private fund is not an independent firm competing for institutional mandates; it is a subsidiary — of a developer, a trading house, a trust bank, an insurer, a railway group. The manager’s name usually announces its parentage, and the parentage announces almost everything else: where its deal flow originates, which trust banks and lenders it defaults to, what kind of assets it will be shown first — and, per Distortion 3, whose interests sit at the head of the table. The relationship is not decorative: buildings move across it in both directions, and — as Distortion 4 will argue — sometimes on a fiscal calendar rather than the market’s.
This is the sponsor system, and it has no real equivalent in the US or European fund industry, where the manager typically is the franchise. In Japan the franchise is the group. A developer-sponsored manager exists, at least in part, to provide its parent with a captive, recurring exit; a trust-bank or insurer-sponsored manager exists to manufacture product for the parent’s institutional distribution; an independent manager exists because its founders believed they could out-execute both — and pays for its independence by having no captive pipeline at all.
The taxonomy matters because it is predictive. Show a Japanese market participant the sponsor’s name, and they will tell you — before opening a single document — roughly what the fund will buy, at what point in the cycle it will be busiest, and how hard its manager will negotiate against the parent. That predictive fluency is precisely what does not survive translation into English research, and building it in the reader is one of this newsletter’s standing projects.
The three tribes of asset managers
Painting with a broad brush, the managers sort into three tribes.
Developer- and group-affiliated managers run the largest books, anchored by flagship private REITs and the listed J-REITs of the same group. Their structural advantage is the pipeline: a parent that develops, owns, and recycles assets at scale. Their structural burden is the same pipeline — the perpetual question of whether an acquisition happened because it was good for unitholders or convenient for the parent. The better houses manage this tension visibly, with pricing committees, third-party appraisals, and the occasional demonstrative refusal. The rest manage it quietly.
Financial-institution-affiliated managers — trust bank, insurer, securities lineage — sell proximity to the buy side rather than to the assets. Their parents hold the relationships with the pensions and regional institutions of Chapter 7, and their products are engineered for those buyers’ constraints: stable, core, appraisal-priced. If the developer tribe’s temptation is feeding the parent’s exits, this tribe’s temptation is asset-gathering — growth in AUM as an end in itself, since the fee, as Distortion 3 noted, is on assets, not outcomes.
Independents — including the foreign houses running Japanese vehicles — live without a captive pipeline, which makes them both the purest expression of investor-aligned management and the tribe that must work hardest for every deal. They source through relationships, brokers, and situations the affiliated houses cannot touch (a parent’s competitor’s asset, say), and they concentrate disproportionately in value-add and opportunistic territory, where execution rather than access is the scarce input.
The people, and the circulation of them
The industry’s org charts are corporate; its knowledge is personal, and it circulates. The talent pool of Japanese real estate finance is small — a few thousand people who matter, cycling among sponsors, managers, trust banks, appraisal firms, and lenders over their careers. Acquisition heads at one house once produced appraisals; fund managers once sat inside trust banks approving entrustments; the person across the table at a negotiation was, ten years ago, a colleague. This is the human substrate of Chapter 4’s observation that no one is fooled by appraisal smoothing: the institutions are distinct on paper and continuous in personnel.
The circulation has a practical consequence for reading the market: reputation is the real regulator. Formal governance in a GK-TK is thin by design, and enforcement litigation is rare. What disciplines behavior is that everyone will meet again — the same counterparties, the same lenders, the same seating charts at industry gatherings. It is a small-pond equilibrium, and it works until it doesn’t: it polices routine self-dealing effectively and systemic groupthink not at all.
The verification layer: trust banks and appraisers
Two supporting casts deserve their own mention, because both function as infrastructure.
The trust banks appear at every altitude of the market: entrusting assets (and, as Chapter 5 noted, screening them in the process), lending, administering funds, distributing product, and sponsoring managers of their own. Their multiple hats mean they see essentially all of the market’s flow — a panopticon position that is itself a subject this newsletter will return to.
The appraisal firms set the numbers the entire private market prices against. Chapter 4 covered the mechanics; the industrial point is that appraisal in Japan is a licensed, standardized, and small profession, concentrated in a handful of major firms, serving clients who are also repeat clients. How that relationship works in practice is best told through one date: July 2022.
Anyone who sat on the acquisition side of this market before then remembers the ritual. Before an appraisal was formally drafted, a fax would arrive from the appraiser — a one-page table of NOI, value, land-building split — with a question attached, in substance: is this level acceptable? The formal report followed the informal clearance. In July 2022, the FSA sanctioned Escon Asset Management, the manager of a listed J-REIT, for exactly the pathological version of this dialogue: when preliminary appraisal figures came in below its parent’s desired sale price on three related-party properties, the manager told appraisers the target and pressed them to raise their values above it — and separately ran a selection process that canvassed several firms for preliminary numbers and hired the highest bidder while citing its fee as the reason.¹ The regulator called it a breach of the duty of loyalty and a compromise of appraiser independence, and suspended part of the firm’s business.
What changed afterward is instructive — and precise. The faxes stopped. The conversation did not; it moved to the telephone. Sounding out an appraiser before the draft, and asking whether a number might be ganbatte — pushed a little further — remains ordinary practice, not a dark secret. The Escon action drew a legal line at a specific configuration: a related-party acquisition, a communicated target price, pressure to clear it. Everything short of that configuration continues, because the underlying structure that produces it is untouched: the appraiser is independent in the way an auditor is independent — genuinely, within a repeat-client relationship that pays it not to be surprising. Nothing about the everyday version is sanctionable, and everything about it matters for how Chapter 11’s first distortion behaves. When you read that appraised values “move slowly and by consensus,” this is what the consensus physically looks like: a phone call before the draft.
How to use this chapter
When the trade press reports a deal, the reader now has a checklist: identify the manager; identify the parent behind the manager; ask which tribe it belongs to; ask whether the counterparty, the lender, or the trust bank shares a lineage with it. Run that checklist on any transaction in this market and the deal will usually explain itself. The names change; the system does not. Chapter 7 turns to the money that funds all of it.
Notes
¹ Financial Services Agency, “Administrative Action against Escon Asset Management Co., Ltd.” (July 15, 2022), following a recommendation by the Securities and Exchange Surveillance Commission dated June 17, 2022. The FSA found that the manager, in acquisitions from its parent for Escon Japan REIT Investment Corporation, had made inappropriate approaches compromising the independence of real estate appraisers — communicating the parent’s desired sale price and pressing appraisers to raise values above it on three related-party properties — and had employed an appraiser-selection process designed to secure a value above the parent’s asking price. Sanctions comprised a three-month partial business suspension (new asset management mandates and acquisition instructions) and a business improvement order. https://www.fsa.go.jp/news/r4/shouken/20220715.html
² Player map: author’s compilation from ARES member disclosures, company filings, and public materials.
7. Who Invests: The LP Landscape
Chapter 4 explained why Japanese institutions love the private wrapper. This chapter maps who those institutions actually are, what each one needs from real estate, and — because the timing matters right now — which of them is quietly stepping back. The roster is unusually knowable: twice a year, ARES and SMTRI survey the fund managers themselves about their investors’ behavior, and the January 2026 read is a snapshot of a market changing hands.¹
The domestic core
Start with the money that built the market.
Corporate pensions are the archetypal private REIT buyer. Japan’s defined-benefit plans spent two decades of zero rates hunting for anything that yielded more than a JGB without looking like equity risk, and appraisal-priced core real estate was the cleanest answer. They remain among the steadiest hands in the pool: in the January 2026 survey, corporate pensions and domestic operating companies were the only domestic classes where reports of increasing allocations still outnumbered decreases — the classic yield-hunter and the balance-sheet investor, both still leaning in while the banks lean out.²
The banking complex is the part foreign readers consistently underestimate, because it has no analogue in their home markets. Three distinct layers of Japanese deposit-taking institutions hold fund equity: the cooperative or keito systems — the agricultural and shinkin cooperative networks whose central bodies, Norinchukin Bank and Shinkin Central Bank, run some of the largest securities portfolios in the country; the major banks; and the regional banks of Chapter 4. For all three, private real estate was never really a property bet; it was a treasury solution — yield for deposit bases that lending could not absorb. That framing is the key to what is happening to it now.
Life insurers remain the quiet constant: long liabilities, appetite for duration-friendly income, minimal mark-to-market noise. Domestic corporates and high-net-worth individuals round out the pool — the latter increasingly reachable through small-lot products and, at the margin, security token offerings, still a sideshow in volume terms but a growing one, and a channel this newsletter will cover separately.
The unwind, from the inside
Here is the January 2026 survey’s most important finding, and it is hiding in a stacked bar chart: across the domestic banking complex, managers now report declining allocations — 13% of managers for the cooperative systems, 17% for major banks, and 24% for regional banks, the weakest reading of any domestic investor class.³
The mechanism is not distress; it is arithmetic. When policy rates were zero, a private REIT unit yielding 3–4% with no reported volatility was the best bond a bank could buy. With the policy rate at 0.75% and JGB yields restored to life, the same unit competes against actual bonds — and loses on liquidity, capital treatment, and now on the FSA’s attention, as supervisors turn to regional bank ALM. The marginal domestic buyer of the last decade is becoming, at minimum, a non-buyer. Chapter 4 flagged regional banks as the stress indicator to watch; the survey shows the needle already moving.
The foreign bid: fewer adds, no exits
The foreign side of the register tells a different story — not an unwind but a hesitation, and the shape of it matters.
Why foreign capital comes has been stable for years: in every survey since mid-2023, the same three reasons top the list — the yield gap relative to funding costs, the currency, and Japan’s political and economic stability.⁴ What changed in January 2026 is the intensity. The share of managers reporting increased allocations from foreign institutions fell from 21% to 7% in six months; from foreign high-net-worth investors, from 34% to 11%. And yet — the detail that separates hesitation from retreat — not a single foreign investor category was reported reducing allocations, and Asian investors outside China and the Middle East kept adding, with roughly a third of managers still reporting increases from that cohort while Middle Eastern and Australian money sat flat.⁵
Read together: the tourists are pausing at the door; the residents are still buying. Rate uncertainty has split the foreign bid into committed capital that has done its homework on Japan itself, and opportunistic capital that came because borrowing cheap yen against higher property yields was easy money — and is now redoing that math. Chapter 11 argued that investors charge Japan extra for being hard to read — this pullback is that charge being applied in real time.
How to read LP flows
Three practical lessons for using this register.
First, the survey’s headline sentiment number is a lagging comfort blanket — in January 2026, 78% of managers reported “no change” in equity investor appetite⁶ — while the class-by-class detail is where the information lives. Aggregates in this market are engineered to look calm; disaggregate everything.
Second, LP flows lead asset prices here more than in most markets, precisely because of Distortion 6: with so much stock held by patient hands, one buyer stepping back — a regional bank redeeming, a Singaporean family office pausing — changes the price at which the next deal gets done, long before any index notices.
Third, watch the handoff. A market where the domestic banking complex is edging out while pensions, corporates, and committed foreign capital hold is a market quietly changing owners at appraisal-anchored prices. Whether that handoff stays orderly is, in one sentence, the central question of Japanese real estate for the next two years — and the recurring subject of this letter’s monthly Private Capital Watch.
Notes
¹ ARES & SMTRI, “Survey on Private Real Estate Funds in Japan,” January 2026 survey (published March 18, 2026); 93 responding fund management companies, effective response rate 63.6%. Figures describe managers’ observations of investor behavior, not investor self-reports.
² Ibid., Figure 2. Corporate pensions: 11% of managers reporting increases; domestic operating companies: 16% — the only domestic classes where increase reports exceeded decrease reports.
³ Ibid., Figure 2. Shares of responding managers reporting declining investment amounts by class: cooperative/keito financial institutions 13%, major banks 17%, regional banks 24%.
⁴ Ibid., Figure 5. Top-cited reasons for foreign investment in Japanese real estate, unchanged in ranking since the July 2023 survey: relative yield-gap attractiveness, currency-driven investment merit, political and economic stability.
⁵ Ibid., Figures 2 and 4. Foreign institutional “increase” reports: 21% (Jul 2025) → 7% (Jan 2026); foreign HNW: 34% → 11%; no foreign category reported declines. By region, roughly one-third of managers reported increased allocations from Asian investors ex-China/Middle East, while Middle Eastern and Australian investors were reported flat.
⁶ Ibid., Figure 1. Equity investor appetite: “no change” 78%, “declining” 17%, “improving” 5%.
8. Who Lends: The Debt Side
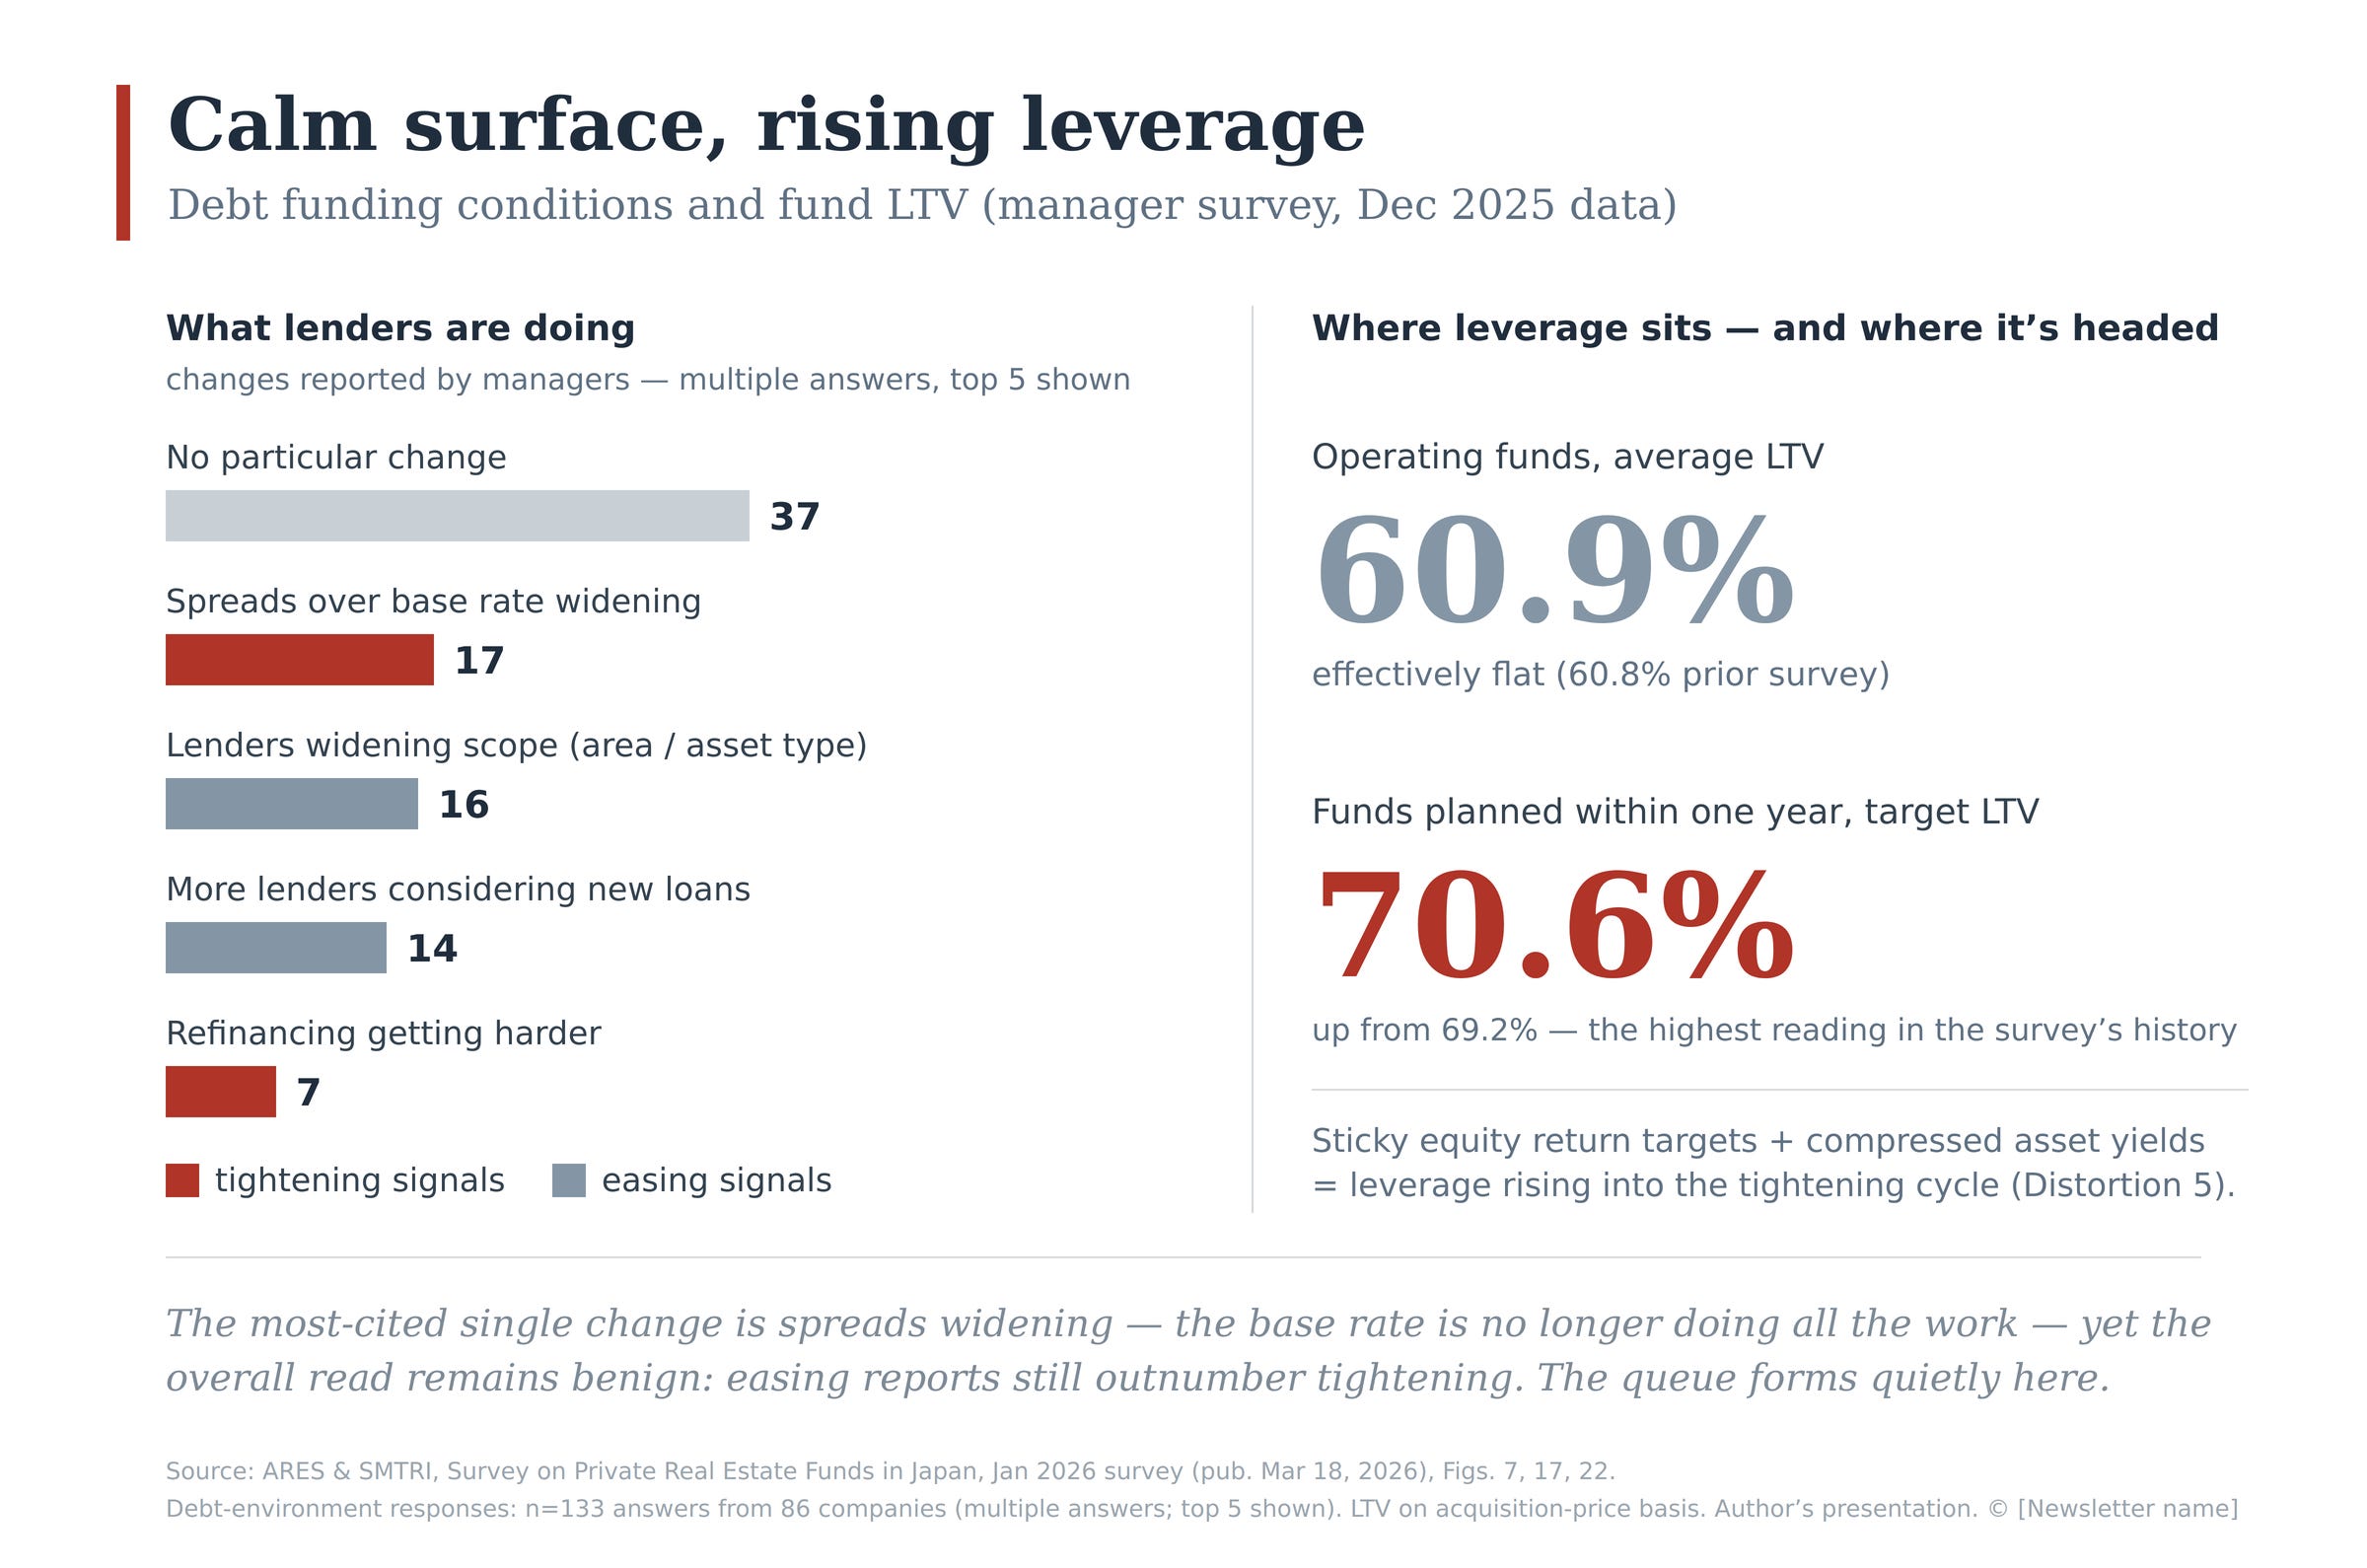
Equity gets the attention; debt sets the terms. Roughly three-fifths of every yen in a Japanese private fund is borrowed — the survey average LTV for operating funds is 60.9%, and funds now being planned are targeting 70.6%, the highest reading in the survey’s history.¹ So the question of who lends, and on what logic, is not a financing footnote. It is most of the capital structure — and how it answers over the next two years will decide how the whole market’s rate transition goes.
The lender stack
Japanese real estate debt is tiered by institution, and the tiers behave differently enough that they should be read as separate markets.
At the top sit the megabanks, the anchor senior lenders for large sponsors and flagship vehicles. Their real estate books are enormous but their logic is only partly about real estate: a loan to a fund is also one strand of a much larger relationship — corporate lending, deposits, investment banking — with the sponsor’s parent. The interest rate reflects that whole relationship, not just the building. This is the “relationship logic” of Distortion 4 in its most concrete form.
The trust banks lend from the middle of their panopticon: the same institutions that hold the assets in trust and administer the funds also finance them, and they see more of each deal than anyone else at the table.
The regional banks enter mostly as participants — taking pieces of syndicated loans and financing assets in their home prefectures. Chapter 7 showed them retreating on the equity side; the debt side is the same institution under the same balance-sheet pressure, one seat over. Their pullback will not starve the market of credit — the loan market does not depend on them the way it depends on the megabanks — but it removes a familiar filler of loan books, and the assets they know best, in the prefectures they know best, will feel it first.
Below the banks sit the nonbanks and debt funds — leasing-company lineages, specialist lenders, and a mezzanine layer that lends the slice between the bank loan and the equity. They finance what the banks won’t: higher leverage, buildings in transition, situations with a story. You might expect this tier — no deposits to protect, no group loyalties — to be where risk finally gets an honest price. In practice, only half true: nonbank pricing is more risk-sensitive than a megabank’s, but it leans heavily on precedent — the numbers of the originator’s previous deals. Even the market’s most mercenary lenders price off the last transaction rather than the next risk. In Japanese credit, the relationship logic goes all the way down.
How the machine prices
Recall the correction from Distortion 5, because it is the spine of this chapter: borrowing costs in Japan look low because the base rate is low, not because lenders charge thin margins. The margins — the spread each lender adds over the base rate — are set with discipline, and they differ by lender type, by sponsor, by asset, by leverage level. That is where the information is. The same building will be financed at different rates depending on whether a megabank relationship is doing the work, whether regional participants are needed to fill out the loan, and whether the top slice requires a mezzanine lender. A foreign borrower who reads only the headline interest rate is reading the least informative number on the term sheet.
The collateral, meanwhile, is Chapter 5’s paper: security over trust beneficiary interests rather than mortgages over buildings, inside bankruptcy-remote structures. And one fact shapes lender behavior more than any contract term: lenders here almost never seize the collateral. When a loan goes wrong, the parties work it out — extend, restructure, bring in support. In a market where no one expects to foreclose, discipline lives at the moment the loan is made, in the relationship, and in the refinancing conversation — not in the courtroom.
The current read: benign, with one new noise
The January 2026 survey’s debt findings are, on their face, reassuring. Asked to rate funding conditions, 68 of 86 managers called them simply “normal,” and the most common reported change was “no particular change” (37 mentions). Signs of easier credit — lenders widening the areas and asset types they will consider (16), more lenders looking at new loans (14) — still outnumbered signs of tighter credit. The December 2025 rate hike to 0.75%, on this evidence, has not yet reached lending behavior.²
But two details deserve more weight than the survey gives them. First, the single most-cited change was lenders widening their spreads (17 mentions). For years, the interest rate on a Japanese property loan moved only when the base rate moved; now the lenders’ own margin has started moving too. That is exactly the transition Distortion 5 said to watch for. Second, “refinancing getting harder” has appeared on the board (7 mentions) — a small number carrying a large signal, for a structural reason. In this market, problems can hide for years: buildings are not sold, and appraisals move slowly, so an over-leveraged fund shows no visible distress. But loans have maturities. At refinance, the lender re-runs the numbers at today’s rates and today’s values, and hidden problems finally become concrete ones — a smaller loan than before, a higher rate, a request for fresh equity. Refinancing is where this market’s problems are forced to show themselves. That is why refinancing friction is not one indicator among many. It is the indicator.
What to watch
Put the pieces together and the watchlist writes itself.
The leverage gap. Funds now being planned target the highest leverage in the survey’s history — 70.6% — at the exact moment rates have begun rising. That is the reverse of what you would expect: rising rates should mean less borrowing, not more. The reason is arithmetic rather than recklessness — investors’ return targets haven’t fallen, property yields have compressed, and extra leverage is the only lever left — but it means the newest funds will have the least room for error if rates keep climbing. The survey itself flags the trend as one to monitor.
The regional bank seat. Not a lifeline, but a signal: their retreat on the equity side (Chapter 7) and the supervisory attention on their balance sheets will show up first as a reduced appetite for loan participations — less a credit crunch than a quiet thinning of the crowd at the syndication table, and one more datapoint that never appears in any interest-rate statistic.
The refinance queue. Watch the trade press for loan maturities being extended, mezzanine slices appearing in loans that used to be senior-only, and sponsors quietly stepping in to support refinancings. In Western markets, a borrower who cannot repay produces what the jargon calls a credit event — a default, a restructuring, something with a headline. In Japan, the same economic outcome is typically processed without one: the maturity extends, the sponsor supports, the mezzanine lender absorbs, and no headline is ever written. The loss is real; only the announcement is missing. Learning to spot the Japanese versions is most of what credit monitoring means in this market.
Notes
¹ ARES & SMTRI, “Survey on Private Real Estate Funds in Japan,” January 2026 survey (published March 18, 2026), Figures 17 and 22. Operating-fund average LTV 60.9% (prior survey 60.8%); planned funds 70.6% (prior 69.2%). Acquisition-price basis.
² Ibid., Figures 6 and 7. Funding-condition rating: 68 of 86 responding companies “normal” (mid-scale), 11 toward “tight,” 7 toward “loose.” Reported changes (n=133 answers from 86 companies, multiple answers): no particular change 37; spread widening 17; lender scope expansion 16; more lenders considering new loans 14; refinancing more difficult 7. The survey characterizes overall conditions as broadly favorable.
9. The Tug of War: Private vs Listed Capital Flows
Distortion 2 made the claim in three sentences; this chapter is the full mechanism. The same building can live in a listed J-REIT or in a private vehicle, and the two homes price it in two different ways — a stock market, and an appraiser. Money flows back and forth between those homes, and the direction of the flow at any given moment is the single most useful thing to know about the Japanese market. This chapter explains how to read it.
Two prices for one building
Start with the two measuring sticks.
A listed J-REIT’s units trade every day. From the unit price, you can work backward to what the stock market thinks the buildings are worth: take the REIT’s rental income, divide by the total value the market is assigning (units plus debt), and you get an implied cap rate — the yield at which the stock market is effectively pricing the portfolio. No appraiser is involved. It moves every day, with interest rates, with sentiment, with everything.
A private vehicle’s buildings are priced the way Chapter 4 described: periodic appraisals, moving slowly and by consensus. Private transactions happen at prices anchored to those appraisals.
Most of the time the two sticks roughly agree. The interesting moments — and the profitable ones — are when they don’t.
Which way the pipeline flows
When listed units trade above the value of the buildings inside them, listed REITs can grow cheaply: issue new units, use the money to buy buildings, and every purchase adds value for existing holders. In those phases, sponsors feed properties from their private side into their listed REITs, the listed market is the eager buyer, and the pipeline flows private-to-listed.
When listed units trade below the value of the buildings inside them, everything reverses. Issuing units would destroy value, so listed REITs stop growing. The stock market is now valuing their buildings below what the same buildings fetch in a private transaction — which creates a strange and very Japanese situation: the cheapest way to buy Japanese real estate is to buy it through the stock exchange, and the most expensive way is to buy the building itself.
Markets do not leave a gap like that alone, but in Japan the gap closes in specific, structural ways rather than through quick trading. Three of them dominated 2024–26.
Listed REITs became sellers. A REIT trading below the value of its portfolio can sell a building at the private market’s higher price, book the gain — often enormous, thanks to the unrealized gains (fukumi-eki) that Distortion 1 described — and use the proceeds to raise distributions or buy back its own cheap units. Selling real estate to buy real estate, at a spread, without leaving the building. Japan Real Estate, one of the market’s oldest names, sold a single Osaka tower for ¥33.4bn and booked a ¥13.2bn gain for distribution. Buybacks, once a rarity, became standard equipment: 22 announcements in 2024 alone — nearly matching the previous seven years combined — and 33 REITs had used the tool by mid-2025.¹
Buyers came for the whole vehicle. If the units price the portfolio at a discount, buying every unit — taking the REIT private — captures the entire gap at once. The attempts escalated from hostile to friendly: Singapore’s 3D Investment Partners launched unsolicited tender offers for two listed REITs in early 2025, and by January 2026 the first sponsor-blessed take-private bid had arrived — for Sankei Real Estate, from funds tied to Tosei together with Singapore’s GIC, with the REIT’s own board recommending acceptance.²
Here is the remarkable part: all three tender offers failed, and all three failed the same way. In each case, the market price of the units rose above the offer during the tender period — for Sankei, even after repeated extensions — so too few holders tendered. The bid itself was the proof that the units were worth more, and the market repriced past it before the bidder could collect. Which yields this chapter’s strangest lesson: in today’s Japanese market, the take-private is a mechanism that closes the gap by failing. The arbitrage gets done; the arbitrageur just doesn’t get paid.
And the private side kept bidding — but look at who, exactly. Not, in the main, the private REITs of Chapter 4: their biggest backers, the domestic banking complex, were already edging away (Chapter 7), thinning the new money they had to put to work. The buyers on the other end of the rope were closed-end private funds — domestic and foreign, sitting on committed capital with investment deadlines — and balance-sheet money: corporates, and overseas core investors buying through separate accounts. Capital that either had to deploy or answered to no index. The Sankei bidders — a domestic fund manager and a sovereign wealth fund, prepared to pay above the portfolio’s appraised value — are a portrait of exactly this money. As long as it keeps transacting at appraisal-anchored prices while the stock market prices the same assets lower, the tug of war continues.
The yield trap: why listed REITs must keep selling
There is a second, quieter engine behind the listed market’s sales, and it has nothing to do with the discount. Two decades of falling cap rates left listed REITs holding portfolios whose yields cannot be replaced. Sell a building today and reinvest in a comparable one — similar location, age, size, asset type — and the replacement will, almost without exception, yield less than what was sold. The portfolio’s income engine shrinks a little with every rotation.
Managers defend their distributions against this trap in two ways, and both are visible across the market. They reach outward — into regional cities, where yields are still fat enough to lift the portfolio average, which is one reason regional assets keep appearing in acquisition lists that used to stop at the Yamanote line. And they harvest — selling appreciated buildings and passing the gains through to the payout. Add the fiscal-period logic of Distortion 4, and a wave of REIT dispositions becomes a sentence with three possible meanings: an arbitrage against the private market, a yield-trap defense, or a book-closing necessity.
Which is why the single most useful habit in reading a J-REIT is separating its two distributions: the one earned by rents, and the one manufactured by sales. Japanese managers themselves disclose the distinction — the stabilized DPU, stripped of one-off gains, versus the headline number — and the gap between the two is the honest measure of the portfolio. A distribution maintained by selling the portfolio is a very different animal from one earned by it. The market prices the headline; the reader should price the stabilized number.
What the January 2026 survey shows: both ends pulling at once
The survey’s transaction data reads like a snapshot of exactly this. On the buy side, 74% of fund managers acquired property in the second half of 2025 — tied for the highest reading in the survey’s history. On the sell side, 48% sold property, up sharply from 38% six months earlier, reversing a long slide.³ The survey attributes the previous reluctance to sell to two things: prices so firm that owners preferred to hold, and the growth of open-end vehicles — which, as Chapter 4 explained, rarely need to sell at all. Sales jumping while acquisitions sit at a record means the market is not rising or falling so much as rotating: assets moving between hands, and between wrappers, at prices the appraisal system keeps anchored.
One more detail completes the picture. Within operating funds, office has fallen to 31% of holdings by value — its lowest share in six years — while logistics has ticked back up and hotels draw the broadest buying interest of any sector: over 40% of managers report domestic and foreign investors alike increasing hotel allocations, the highest reading of any property type.⁴ Read those shifts carefully, though, because none of them means anything is cheap. Prices are elevated across the board — offices, logistics, residential alike. What separates the sectors is not the level of prices but what is holding them up. Office prices have outrun their rents: the survey’s own explanation for the falling share is that managers struggle to justify what sellers ask. Logistics has come off its supply-glut peak just enough for deals to pencil again — softer than it was, not cheap. And hotels are the one sector where the income itself is surging: average daily rates have climbed with the inbound boom, so high prices there are being chased, and partly justified, by genuinely rising cash flows. In a market where everything is expensive, the tug of war sorts buyers by what they are willing to believe: deadline-driven funds and balance-sheet money still paying up for offices on faith in the exit, and nearly everyone bidding for the one sector where the income is doing the work.
How to read the dial
For the reader, this chapter reduces to one master dial and three things that move with it.
The dial is the gap between the listed market’s implied cap rates and private-market appraisal cap rates. When listed pricing is richer than private, expect unit issuance, sponsor injections, and listed REITs growing. When listed pricing is cheaper than private — the 2024–26 configuration — expect asset sales out of listed REITs, buybacks, take-private attempts, and private capital doing the buying.
The three confirmations: the equity issuance calendar (listed REITs raising money is the clearest sign the gap has closed); the direction of sponsor pipelines (which way are the group’s buildings moving?); and the identity of buyers and bidders in the trade press — including the failed ones, because in this market even an unsuccessful tender offer resets what everyone thinks the assets are worth.
None of these signals requires anything beyond public information and the Japanese-language trade press. Which is, by now, a familiar sentence: the dial is public; the habit of reading it is not. The monthly Private Capital Watch reads it so you don’t have to build the habit from scratch.
Notes
¹ Property sale and gain: Japan Real Estate Investment Corporation disclosures (JRE Dojima Tower, sold across the September 2024 and March 2025 fiscal periods). Buyback counts: 22 buyback announcements in 2024 versus 26 in 2017–2023 combined (Daiwa Asset Management, February 2025, from ARES data); 33 REITs had conducted buybacks as of H1 2025 (Sumitomo Mitsui Trust Research Institute, September 2025).
² 3D Investment Partners: unsolicited tender offers for NTT UD REIT and Hankyu Hanshin REIT (early 2025), both stated as investment-purpose; both lapsed with unit prices above the offer. Sankei Real Estate: take-private tender offer by funds managed within the Tosei group together with GIC (announced January 2026, board-recommended); unsuccessful as of May 2026 after repeated extensions, with the unit price above the offer. Details per tender offer filings and result disclosures.
³ ARES & SMTRI, “Survey on Private Real Estate Funds in Japan,” January 2026 survey (published March 18, 2026), Figures 8–9. Acquisition share 74% (tied with July 2024 for the series high); disposal share 48%, up from 38%.
⁴ Ibid., Figures 3-1, 3-2, and 12. Office at 31% of operating-fund holdings by value, the lowest in six years; logistics rising from the prior survey; hotel allocations increasing per over 40% of managers for both domestic and foreign investors, the highest of any property type.
10. How Foreign Investors Can Actually Participate
Here is the paradox this guide has been circling. Japan places almost no legal restrictions on foreign ownership of real estate: a foreign individual or fund can hold Japanese buildings and land outright, with the same rights as a domestic owner, and no approval process for ordinary commercial property.¹ The wall, as Chapter 1 said, was never legal. It is a wall of legibility — and it stands in front of some doors more than others. There are four ways in, and they demand very different amounts of reading.
Door one: buy the building
The most direct route — and for large institutions, a busy one. Overseas core investors buy Japanese towers through separate accounts and joint ventures every month; the sovereign wealth fund that bid for an entire listed REIT in early 2026 is only the most visible face of a well-worn path. But walking through this door means inheriting the whole machine described in Part II: the property will come wrapped in a trust beneficiary interest, the trust bank will be in the room, the price will be negotiated against a kantei appraisal, and the lender’s terms will follow relationship logic as much as risk. Nothing stops a foreign buyer from doing this. Everything in this guide determines whether they do it well. This door is realistically for investors writing very large checks with local advisors — or local platforms — attached.
Door two: buy into the funds
One step removed: commit to a Japanese private fund — commingled, club deal, or a separate account run by one of Chapter 6’s managers. This is where Chapter 5 becomes practical rather than academic. Foreign capital in the equity usually means a TMK rather than a GK-TK, because a foreign investment committee wants an entity whose ownership it can diagram. If you are offered a GK-TK position instead, know that the “silent partner” label overstates the reality: writing the fund’s major decisions into the TK agreement as matters requiring the investor’s consent is a routine ask, and whether the asset manager accepts it is a business judgment, not a legal battleground. And the single most valuable underwriting question is not about the building at all — it is Chapter 6’s question: who is the sponsor behind the manager, and is this fund a showcase or an exhaust pipe?
Door three: buy the listed market
The unglamorous door, and — in the current configuration — arguably the smartest one. Chapter 9 established that when listed units price below what the same buildings fetch privately, the stock exchange is the cheapest place to buy Japanese real estate. That configuration has now persisted long enough to attract tender offers, buybacks, and activists, and it is available to anyone with a brokerage account: J-REIT units — where portfolios are re-appraised every period and the gap between book and appraised value is disclosed — and the shares of developers and sponsors, where corporate accounting still carries decades-old land at cost, with current values relegated to the footnotes. Whether the stock market is undervaluing those assets or the assets themselves are overvalued at today’s prices is precisely the question — and it is a question this letter’s tools are built to work on, not one to assume away in either direction. The catch is the flip side of the discount: you are buying through the sponsor system, with all of Distortion 3 attached, so the discount you pay for governance should be judged sponsor by sponsor. And read the payout before the yield: Chapter 9’s yield trap means some headline distributions are rents and some are recycled sale gains, and the difference is disclosed for anyone who looks — which is a reading problem, not a trading problem.
Door four: use the information without buying a building at all
The least obvious door. Chapter 7 showed that investor flows lead prices here; Chapter 9 showed that the private market’s behavior — what the funds buy, what the REITs sell, which tender offers appear — moves listed prices with a lag you can watch in the trade press. A reader who never touches a Japanese building can still use the private market as an early-warning system for positions in listed J-REITs, developer equities, and even the yen rates complex. The information wall works in both directions: it keeps most foreign investors out, and it hands an edge to the few who read through it.
What the foreign money is actually doing
For calibration, the January 2026 survey’s snapshot of your fellow travelers: the reasons foreign capital gives for being in Japan have not changed in three years — the yield gap over funding costs, the currency, and political stability. The intensity has: far fewer managers report foreign investors adding, though none report them selling, and Asian investors outside China and the Middle East remain the most consistent buyers.² Hesitation, not exit — which, for a patient reader, is the definition of a window.
The checklist, assembled
Everything in this guide compresses into five questions to ask of any Japanese exposure, through any door. Who is the sponsor, and which tribe (Chapter 6)? What is the appraisal assuming, and how stale is it (Chapter 4)? What does the debt actually cost, and who provides it (Chapter 8)? Which wrapper holds the asset, and why that one (Chapter 5)? And which way is the private–listed pipeline flowing this quarter (Chapter 9)? None of these questions requires inside information. All of them require Japanese. That asymmetry is the last distortion on the list — and the reason this newsletter exists.
Notes
¹ Japan imposes no general foreign-ownership restrictions on real estate. The main exception is notification and review requirements for land near designated defense-related and border facilities under the 2021 Important Land Survey Act — rarely relevant to institutional commercial property.
² ARES & SMTRI, “Survey on Private Real Estate Funds in Japan,” January 2026 survey (published March 18, 2026), Figures 2, 4, and 5. Top-cited investment reasons unchanged since July 2023: yield gap, currency, political and economic stability. Foreign “increase” reports declined sharply from the prior survey with no category reported reducing; Asian investors ex-China/Middle East remained the most active adders.
11. The Distortions: Where the Inefficiencies Live
Every chapter so far has described machinery. This one describes what the machinery does to prices. None of what follows is a trade recommendation; all of it is a map of where the Japanese market systematically diverges from what a textbook — or a global investor’s intuition — would predict. Seven distortions, in roughly ascending order of how much money cares about them.
Distortion 1: The appraisal-to-market gap
Chapter 4 established that appraised values move slowly and by consensus. The consequence is a permanent, measurable gap between where appraisals sit and where transactions clear. In a rising market, appraisals run below the market: listed J-REITs show large unrealized gains (fukumi-eki) on their books, private REIT NAVs understate what the portfolios would fetch, and “NAV discounts” on listed units are not always what they appear. In a falling market, everything reverses, with a lag measured in quarters, not weeks. Anyone comparing a J-REIT’s price-to-NAV ratio against a US REIT’s is comparing two numbers produced by fundamentally different clocks. The gap itself is not tradable. Knowing which side of it you are standing on at any given moment is.
Distortion 2: The listed–private arbitrage that only closes in one direction
The same building, held in a listed J-REIT and in a private fund, is priced by two different mechanisms — a stock market and an appraiser. When listed units trade well above appraisal NAV, sponsors feed properties from the private side into the listed side; when they trade below, the pipeline reverses or stalls, and listed REITs quietly become the cheapest real estate in Japan — cheaper than the identical asset changing hands in the private market. That was the story of 2024–26: implied cap rates on listed J-REITs sat visibly wide of private transaction cap rates, and the wave of take-private attempts, unit buybacks, and activist positions was the market’s arbitrage response. The distortion persists because the arbitrageurs face frictions — takeover mechanics for investment corporations are clumsy, and sponsors have every incentive to keep captive vehicles captive. Which brings us to Distortion 3.
Distortion 3: The sponsor’s two hats
An external asset manager is owned by the sponsor and paid on assets under management, not on unitholder returns. The sponsor is simultaneously the REIT’s master-lease tenant, its property supplier, its lender introducer, and frequently the counterparty on both ends of a transaction — while the REIT, in turn, serves as the sponsor’s buyer of last resort when a building needs a discreet exit from the sponsor’s balance sheet. Japanese market participants price this in fluently — everyone knows which sponsors treat their REITs as balance-sheet exhaust pipes and which treat them as showcases — but that knowledge lives in Japanese, in trade journals, and in the seating charts of industry gatherings. It rarely survives translation into English research. The result: foreign investors persistently misprice governance, in both directions. They pay too much for some sponsor pedigrees and demand too large a discount for others.
Distortion 4: The fiscal-period clock
Every market has a calendar, but in Japanese real estate the calendar is a pricing force. A share of transactions here is timed not by the market but by the books: a sponsor needing to show a gain can sell a building into its REIT before its own period-end; a REIT short of its distribution forecast can sell a building out before its period-end. Both trades appear in the trade press looking exactly like ordinary market activity — and here is the uncomfortable part: from the outside, they cannot be reliably told apart. Whether a given deal was a market decision or a book-closing decision is not public information, and not even common knowledge inside the market; it travels, when it travels at all, through close relationships with the companies involved. What can be known is the structure: the motive exists (Distortion 3’s sponsor system), the mechanism exists (an appraisal, per Distortion 1, that can print a defensible price on schedule), and the deadline exists (someone’s fiscal period is always closing). The practical lesson is therefore not a detection trick but a discount: treat every related-party transaction price, and every conveniently timed disposal gain, as carrying an unobservable probability of having been driven by the calendar rather than the market — and weight it accordingly when you use it as a price signal. In most markets, a printed transaction is evidence. In this one, it is testimony from a witness who may have had reasons.
Distortion 5: Financing that ignores the yield curve
The average LTV of operating private funds is around 61%; funds planned for launch within a year now target roughly 71%, the highest reading in the survey’s history — leverage rising into a tightening cycle, because equity return targets are sticky while asset yields have compressed.¹ Foreign observers routinely look at all-in borrowing costs in Japanese real estate — still remarkably low by global standards — and conclude that lenders are mispricing risk. They are misreading the anatomy of the number. The base rate is low because Japanese policy rates are low; the spreads charged over it are not unusually thin, and they are tiered with discipline across lender classes and asset profiles. What is distinctive is what moves the price of credit: lender behavior here is driven as much by relationship logic and regulatory posture as by market signals, which means credit conditions in Japan shift through channels a spread chart never shows. When the FSA’s supervisory stance changes — as it is now changing on regional bank ALM — a borrower’s access to leverage can deteriorate while every observable pricing metric still looks benign. Stress scenarios calibrated on US or European experience, where credit tightening announces itself in spreads, systematically mistime Japan.
Distortion 6: The patient-buyer floor
Chapter 4’s systemic observation deserves its own entry here. A growing share of Japanese commercial real estate is held by owners who mark slowly and never have to sell: private REITs, corporate balance sheets, and owners sitting on decades of embedded gains with no tax-efficient exit. When prices should be falling, this group simply stops transacting — so the fall takes far longer to show up in any number. It is why Japanese “market” corrections tend to arrive as volume droughts rather than price crashes — transactions simply stop until appraisals and seller expectations drift down to meet bids. For an investor, the practical meaning is that Japanese price indices understate risk and overstate stability, and that the true state of the market at any moment is visible in volume and queue data — transaction counts, redemption notices, brokerage inventory — long before it is visible in price. Most of that data is published. Almost none of it is published in English.
Distortion 7: The information asymmetry itself
The final distortion is the one this publication exists for. The gap documented in Chapter 1 — a ¥47 trillion market whose census, trade press, and practitioner discourse exist only in Japanese — is not merely an inconvenience. It shows up directly in prices. Foreign investors demand extra yield from Japan to compensate for what they cannot read — an information problem they could solve for the cost of a translator — and domestic players pocket the difference. In January 2026, the share of surveyed managers reporting increased allocations from foreign institutional investors fell from 21% to 7% in six months — a pullback driven, on the evidence of the same survey, less by anything visible in Japanese fundamentals than by rate uncertainty and the plain difficulty of committing money to a market you cannot read.² Both halves of that sentence are the opportunity. The asymmetry rewards anyone on the right side of the wall, and it penalizes capital that cannot see through it. Every issue of this newsletter is an attempt to move readers from the second group to the first.
What this list is for
Seven distortions, one common structure: in each case, the market is not irrational — it is rational under constraints that are invisible from outside the language. The appraisal clock, the sponsor seating chart, the fiscal calendar, the lender’s regulatory posture, the patient buyer’s tax position: these are knowable things. The recurring work of this publication is to track them in real time — which appraisal gaps are widening, which sponsors are feeding which vehicles, which lenders are pulling back from which borrowers — using the Japanese-language record that produces roughly none of its own English translation. The map ends here. The territory starts in the next issue.
Notes
¹ Association for Real Estate Securitization (ARES) & Sumitomo Mitsui Trust Research Institute (SMTRI), “Survey on Private Real Estate Funds in Japan,” January 2026 survey (published March 18, 2026). Average LTV of operating funds: 60.9%; average target LTV of funds planned for launch within one year: 70.6%, up from 69.2% in the prior survey — the highest reading in the survey’s history. LTV figures are calculated on an acquisition-price basis.
² Ibid., Figure 2 (equity investor investment amounts by investor type). The share of responding fund managers reporting increased investment amounts from foreign institutional investors fell from 21% (July 2025 survey) to 7% (January 2026 survey); foreign high-net-worth allocations showed a similar decline (34% to 11%). No foreign investor category reported outright declines. Respondents are fund management companies (93 firms; effective response rate 63.6%).
12. Conclusion: What to Watch in 2026–27
This guide has been a map. Maps are judged by whether you can navigate with them, so here is the navigation: the six dials that will decide how Japan’s real estate market handles its first real rate cycle in a generation, each one drawn from a chapter you have now read.
The policy rate and the JGB curve. Everything in this market was built at zero. At 0.75% and rising, every other dial below starts moving. The survey’s own respondents have named their pain point: among managers who say they might change investment policy, the most-cited trigger is a 10-year JGB reaching 2.5% — up from 2.0% just six months earlier. The market is telling you, in its own words, where the current prices stop making sense to it.¹
Regional bank behavior. The most rate-sensitive holders of the most liquidity-mismatched vehicle (Chapter 4), already the weakest equity bid (Chapter 7), under active FSA scrutiny on ALM (Chapter 8). They are the single best early-warning indicator this market has.
Private REIT redemptions. The open-end promise has never met a falling market. Watch notice volumes, caps, and queues — none of which will appear in any NAV.
The refinance queue. In a market where nobody forecloses, problems surface at maturity: extensions, mezzanine slices in senior-only stacks, sponsors quietly supporting. The loss is real; only the announcement is missing (Chapter 8).
The listed–private gap. The master dial of Chapter 9. Issuance returning means it has closed; more failed tender offers mean it hasn’t. Either way, it tells you which wrapper is the cheap one this quarter.
The handoff. Beneath everything: a market changing owners at appraisal-anchored prices — banks out; pensions, corporates, deadline-driven funds, and committed foreign capital in. Whether that rotation stays orderly is the central question of the next two years.
None of these six requires inside information. All of them require reading Japanese sources most investors will never open. That was the argument of this guide, compressed: Japan’s private real estate market is not hidden — it is unread, and the difference between those two words is where the opportunity lives.
This is what the newsletter does from here. A weekly letter reads the deal flow; the monthly Private Capital Watch reads the six dials above — fund flows, redemption signals, lender behavior, the listed–private gap — from the Japanese-language record. If this guide told you how the machine works, the letter tells you what it did last week. The map ends here. The territory starts in the next issue — subscribe, and read the market from the right side of the wall.
Notes
¹ ARES & SMTRI, “Survey on Private Real Estate Funds in Japan,” January 2026 survey (published March 18, 2026), Figure 25: among the 21 responding managers contemplating a possible change in investment policy in response to rising rates, the most-cited threshold for reconsidering was a 10-year JGB yield of 2.5% or above (most-cited level in the prior survey: 2.0%). The threshold is a trigger for policy review — typically lower acquisition price targets or reduced investment — not a return target.